Additional important metrics
Below, we’ve identified a number of important metrics used to measure performance, categorized by instance status and health, cluster operation and connection metrics, instance hardware metrics, and replication metrics. We’ve included some general recommendations, but it’s important to account for your specific use case and requirements to determine what values are best in your particular context.
Instance status and health
The status of a MongoDB server process can be an indication of whether we need to drill down into its activity or health. A process that is unresponsive or does not answer to our commands should be immediately investigated.
- Monitor with MongoDB Atlas: Cluster health and process health can be seen via the Cluster view. Green dots means a healthy state, while orange and red mean there are issues with the process.
- Monitor self-managed MongoDB instances: Commands such as rs.status() for replica sets and sh.status() for sharded clusters provide a high level status of the cluster.
Cluster operation and connection metrics
When your application is struggling or underperforming, you may want to investigate the database layer as a potential bottleneck. The application establishes connections and performs operations against the database, so pay close attention to its behavior.
MongoDB provides various metrics and mechanisms to identify its connection and operation patterns. On top of the active and proactive monitoring tools, Atlas provides a full alerting system and log gathering.
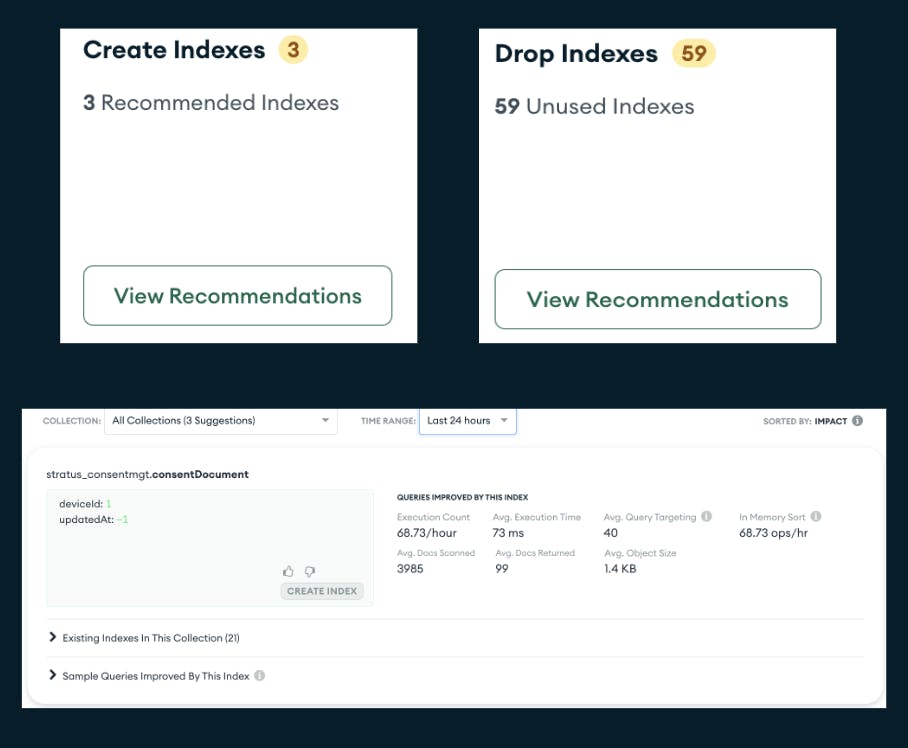
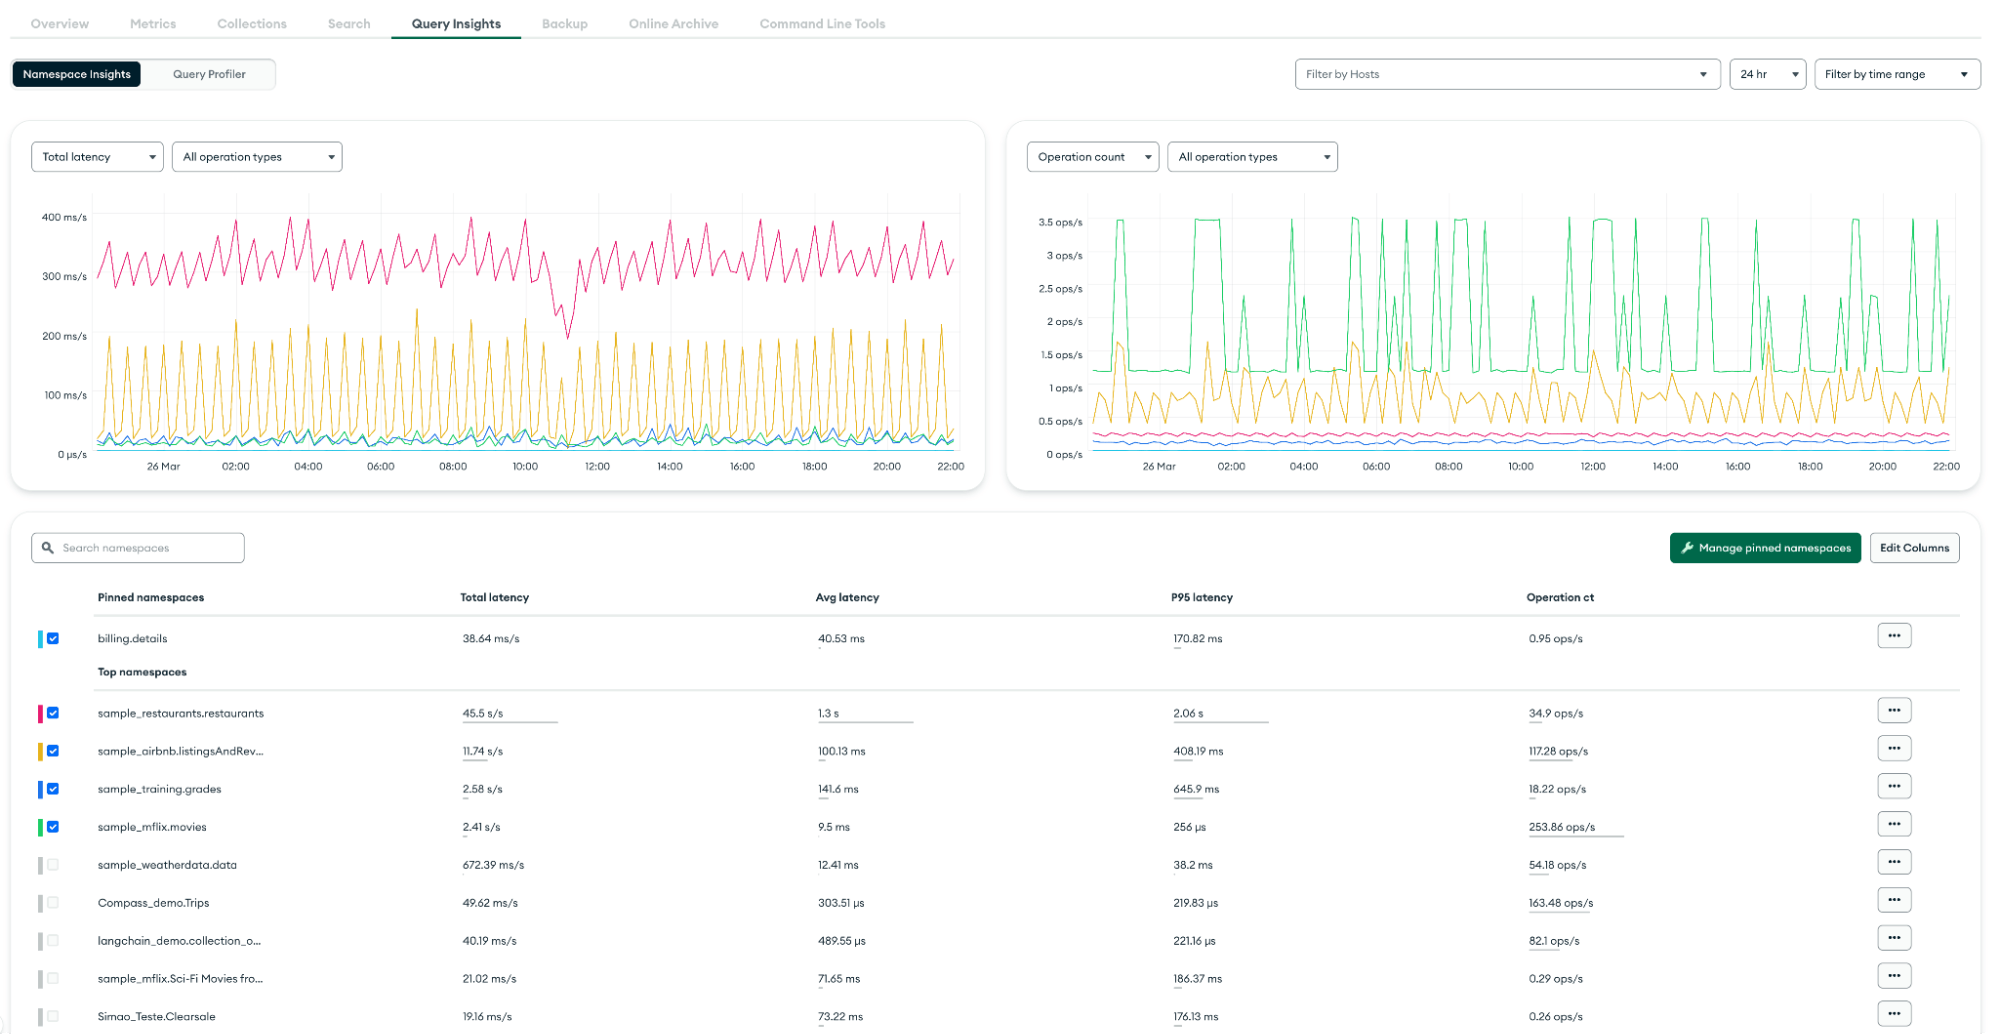
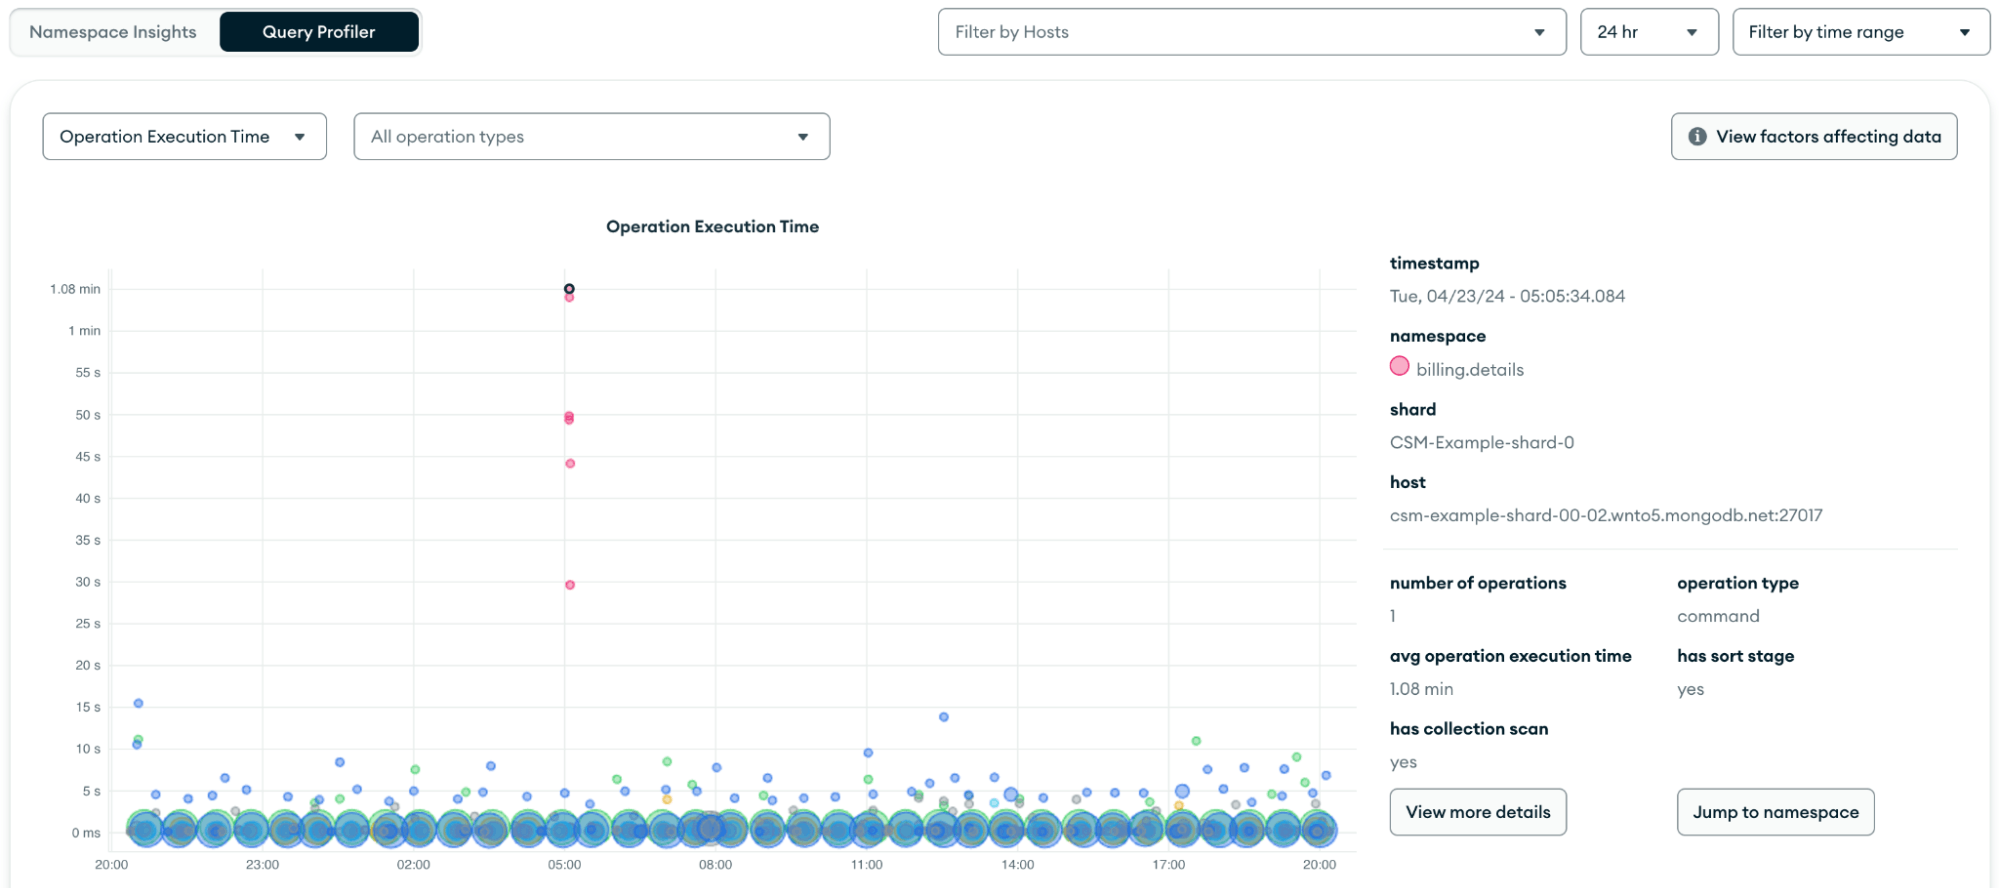
- Monitor with MongoDB Atlas: Atlas provides built-in features like Performance Advisor, Real-Time Performance Panel, Namespace Insights, and Query Profiler tto track operations and highlight slow and heavy spotted operations. Additionally, the Metrics tab provides many graphs that plot operations and number of connections. See below for more details:
| Metric | Definition | Importance | Signals |
| Opcounters
| Tracks the number and type of operations performed against the database, including inserts, updates, deletes, and queries.
| Provides insight into the overall workload of the database, helping to identify bottlenecks or performance issues.
| Good: Predictable activity based on application usage.
Bad: Unexpected changes in behavior or sudden spikes/drops in normal activity will often prompt further investigation.
|
| Operation Execution Time
| Average time taken to execute database operations, measured in milliseconds.
| A performance indicator–longer execution times can lead to slower application response.
| Good: Low and stable execution times.
Bad: Increasing execution times may signal performance degradation, potentially due to resource contention or inefficient queries.
|
| Query Targeting
| Ratio of documents examined relative to the number of documents returned across all operations during a sampling period.
| An overall measure on how efficiently the database is running.
| Good: For frequently run queries, aim for as low a value as possible.
Bad: Spikes or sustained levels of high query targeting most often means there are opportunities to improve query efficiency.
|
| Connections
| Total number of active connections to the database at any given time.
| Connections are a finite resource and should be used efficiently.
| Good: Predictable and stable connection counts over time, within cluster tier limits.
Bad: Higher connection counts than the application requires or trends toward cluster tier limits may lead to unnecessary resource consumption or the inability to establish new connections.
|
| Queues
| Number of operations waiting to be processed by the database, indicating the level of demand versus capacity.
| Identify potential bottlenecks and ensure the database can handle incoming requests efficiently.
| Good: No queues indicate that the database is processing requests promptly.
Bad: Queues suggest that the database is not able to process operations at the rate they are being issued, leading to increased latency and potential timeouts.
|
| Scan And Order
| Average rate per second over the selected sample period of queries that return sorted results that cannot perform the sort operation using an index.
| In-memory sorts can be very expensive as they require large result sets to be computationally sorted at runtime.
| Good: 0, database didn't perform any in-memory sort operations.
Bad: a large value indicates the database performed many in-memory sort operations.
|
- Monitor with self-managed MongoDB instances:
- You can leverage tools like mongostat and mongotop.
- Once you connect via Compass to your instance, you can use the MongoDB Compass Performance Tab, which is similar to Atlas Real-Time Performance Panel.
Instance hardware metrics
Hardware metrics can be used to identify which resources could be a constraint for performance issues or which need tuning and capacity re-planning.
- Monitor with MongoDB Atlas:
- The Atlas metrics tab within a cluster provides plotted graphs for the hardware metrics. These allow you to correlate them with other database metrics. See below for more details:
| Metric | Definition | Importance | Signals |
| Normalized System CPU
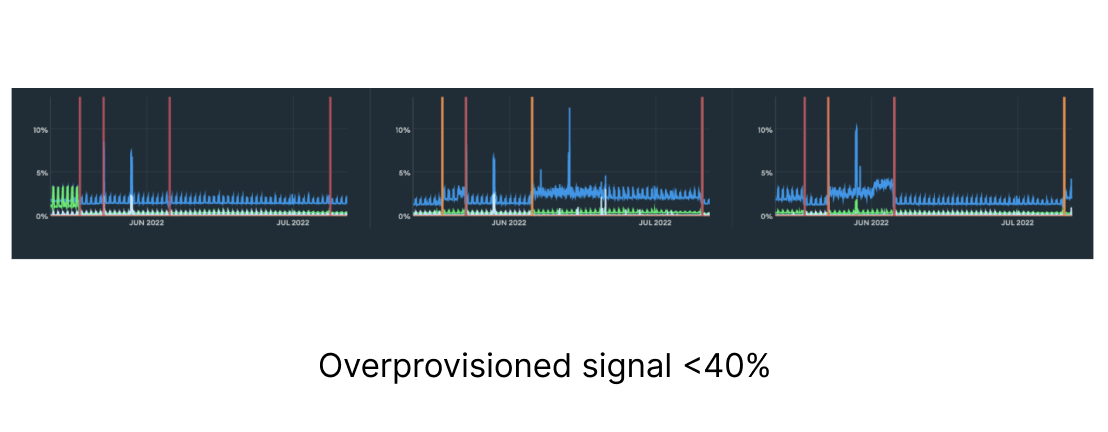
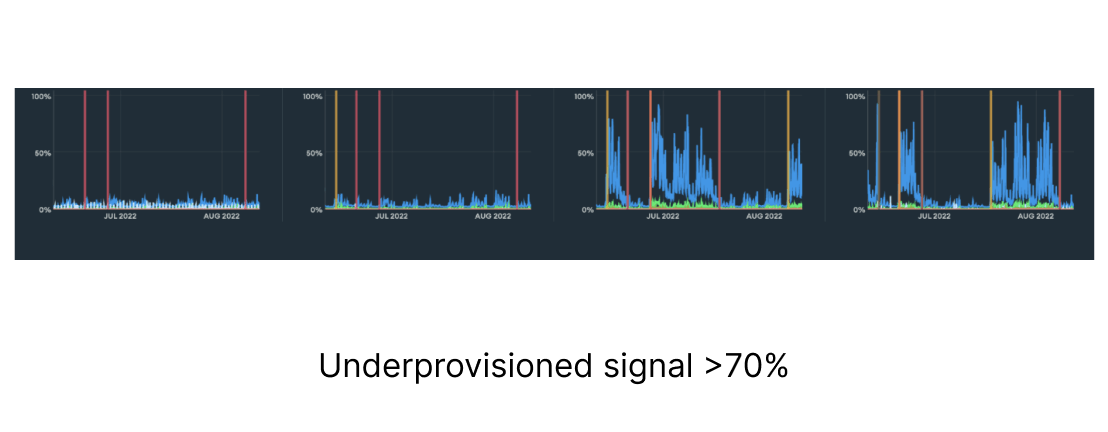
| The CPU usage of all processes on the node, scaled to a range of 0-100% by dividing by the number of CPU cores.
| Helps determine if the correct cluster tier is in use. An improper tier can lead to higher costs if overprovisioned or potential downtime if underprovisioned.
| Good: A healthy range is often between 40% and 70%.
Bad: Under 40% may indicate potential overprovisioning, while over 70% may indicate potential underprovisioning.
|
| Normalized Process CPU
| The percentage of CPU resources utilized by the database process, normalized to account for the number of CPU cores available.
| Indicates how efficiently the database is using CPU resources, helping to identify potential performance bottlenecks.
| Good: Values around 40-70%.
Bad: Values consistently above 80% may indicate CPU contention, while very low values could suggest underutilization.
|
| Disk Latency
| Average time taken for read and write operations on the disk, measured in milliseconds.
| A measure of disk performance–high latency can significantly impact database performance and user experience.
| Good: Low latency values (typically under 5ms).
Bad: High latency (over 20ms) can signal disk bottlenecks or issues with the underlying storage infrastructure.
|
| Disk IOPS
| Number of input/output operations per second.
| Clarifies the disk's ability to support database workloads, especially for read/write-heavy applications.
| Good: Low IOPS relative to limits.
Bad: High IOPS values relative to limits.
|
| Disk Space Free
| Amount of available disk space.
| Ensures that there is sufficient space for data growth.
| Good: Above 20% of total capacity.
Bad: Below 10% capacity can potentially lead to extended downtime if available space is fully depleted.
|
| System Memory
| Total amount of RAM being used.
| Critical for performance–adequate memory can reduce disk I/O and improve query response times.
| Good: Moderate memory usage relative to cluster resources.
Bad: High memory usage relative to cluster resources may indicate potential memory pressure, while very low usage could suggest underutilization.
|
- Monitor with General MongoDB instances:
- Use your operating system tools (top, iostat, etc.).
Replication metrics
Replication is a key aspect of MongoDB clusters' availability and durability. The health and performance of replication needs to be carefully monitored in order to maintain a healthy cluster.
- Monitor with MongoDB Atlas: The Atlas metrics tab within a cluster provides plotted graphs for the replication metrics. See below for more details:
| Metric | Definition | Importance | Signals |
| Replication Lag
| The approximate number of seconds the secondary is behind the primary for write operations.
| Indicates how current the secondary nodes are compared to the primary, affecting data consistency and availability.
| Good: Low lag, typically under 5 seconds.
Bad: High lag (over 10 seconds) can lead to stale reads and potential data loss during failover.
|
| Replication Oplog Window
| Duration of write activity actively held in the oplog.
| Allows secondaries to catch up with the primary. A sufficiently large oplog window allows for replication and/or resyncs of data.
| Good: An oplog window of several hours.
Bad: A short window (under 1 hour).
|
| Oplog GB/hour
| Amount of data written to the oplog per hour, measured in gigabytes.
| Assesses the write load on the primary.
| Good: Predictable and expected values based on application activity.
Bad: Unpredictable values based on application activity.
|
- Monitor with General MongoDB instances: Use the usage of the following MongoDB Commands:
MongoDB provides built-in UI tools in Atlas as well as Cloud Manager and Ops Manager to help you monitor performance. MongoDB also offers some standalone tools and commands to look at more raw data.
Below are some utilities and commands you can run directly against the server via MongoDB Shell.
mongostat
mongostat is used to get a quick overview of the status of your MongoDB server instance. It’s best used for watching a single instance for a specific event as it provides a real-time view. You can use this command to monitor basic server statistics such as operation breakdown, MongoDB memory statistics, lock queues, connections, and the network.
You can execute the MongoDB command through the following syntax:
See example output here.
mongotop
mongotop tracks the amount of time a MongoDB instance spends reading and writing data per collection.
You can execute the MongoDB command through the following syntax:
See example output here.
rs.status() returns the replica set status. It is done from the point of view of the member where the method is run.
See example output here.
db.serverStatus()
db.serverStatus() provides a document representing the current instance metrics counters. Run this command at a regular interval to collect statistics about the instance.
See example output here.
dbStats
dbStats command returns the storage statistics, such as the total collection data versus storage size, number of indexes and their size, and collection-related statistics (number of documents and collections), for a certain database.
See example output here.
You can monitor MongoDB databases by using different tools like mongostat, mongotop, dbStats, and serverStatus commands. These commands provide real-time monitoring and reporting of the database server, allowing you to monitor errors and database performance and assist in informed decision making to optimize a database.
Summary
MongoDB provides a variety of metrics and tools to monitor your database and help ensure it’s running at optimal performance. From UI tools and advisors to raw-data metrics, you're covered whether self-hosting or using MongoDB Atlas.
Get started in learning more about the metrics and tools to monitor your database by earning a Monitoring, Tuning, and Automation Skill Badge.
For more information on monitoring MongoDB databases, see the following resources.
References:
MongoDB Atlas Monitoring
MongoDB Performance
MongoDB Performance Best Practices
MongoDB Professional Services
Appendix
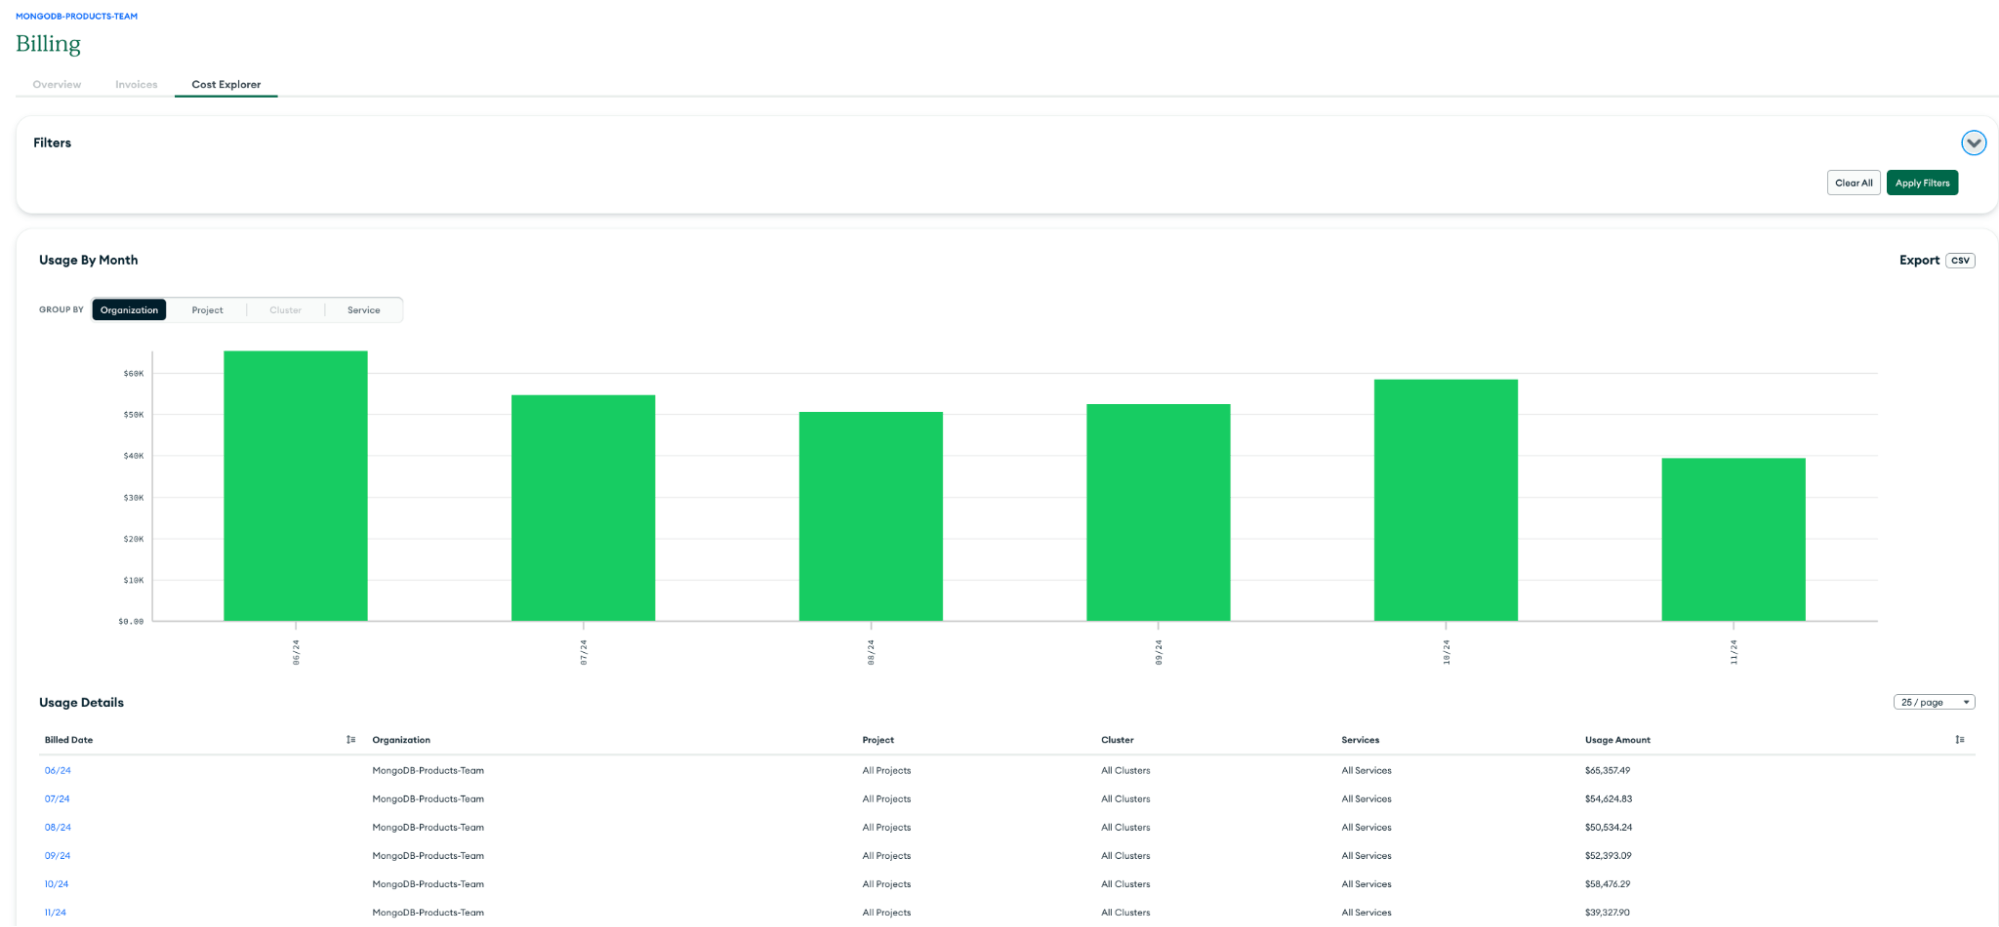
Billing Cost Explorer
Cloud Manager
Cluster View
Compass Performance Tab
Connections
db.serverStatus()
dbStats
Disk IOPS
Disk Latency
Disk Space Free
Metrics Tab
Mongostat
Mongotop
Namespace Insights
Normalized Process CPU
Normalized System CPU
Oplog GB/hour
Opcounters
Operation Execution Time
Ops Manager
Performance Advisor
Queues
Query Profiler
Query Targeting
Real-Time Performance Panel
Replication Lag
Replication Oplog Window
rs.printReplicationInfo()
rs.printSecondaryReplicationInfo()
rs.status()
Scan And Order
System Memory