Dashboard Filters
Dashboard filters refine data across some or all of the charts in a dashboard. They allow you to view a common subset of data across the dashboard's charts.
Dashboard Authors or Owners can:
Select the fields that all dashboard users can use to filter data.
Set initial default values for each filter.
Disable filtering for a specific chart. Disabling filtering exempts the chart from dashboard filters.
All dashboard users can filter based on values they specify and save their own default filter values.
Note
Users who open a dashboard using a public link can't save their own default filter values. Charts reverts to the initial default filter values after refreshing the page or starting a new session.

If one or more dashboard filters affect the data a chart displays, an icon displays in the bottom left corner of that chart. Hover over the icon for a list of the filtered fields impacting that chart.
Note
Dashboard Authors or Owners define filters using specific
data sources and can disable filtering on specific charts. A single filter might not refine all charts
if:
The dashboard contains charts mapped to data sources that the filter doesn't use.
A dashboard
AuthororOwnerdisables filtering on some charts.
Considerations
Dashboard filters don't support lookup fields, calculated fields and missing fields. If you want to add a lookup or calculated field, create a charts view and use it as a data source.
If you have filters on a chart or dashboard, use an index to improve its performance.
Example Scenario
A dashboard Author creates a dashboard with charts that contain
sales data for all of a company's customers. The author creates a
filter allowing dashboard viewers to select which region(s) to
display data from. Members of a sales team use this filter to display
customer data only for the region(s) that they cover.
Tip
You can use a prebuilt sample dashboard to experiment with dashboard filters.
Filter Persistence Per Dashboard Viewer
Charts persists the following states for each dashboard viewer across reloads and user sessions:
which filters are enabled or disabled
field values chosen to filter dashboards
whether the Dashboard Filters is expanded or collapsed.
The changes that a dashboard viewer makes to filters don't affect other
Charts users. A viewer's saved filters are not affected when a
dashboard Author or Owner modifies a filter's default values
unless you reset a filter.
Note
Charts doesn't persist filter states or values for users who open a dashboard using a public link. Charts reverts to the initial default filter values after refreshing the page or starting a new session.
The Dashboard Filters Pane
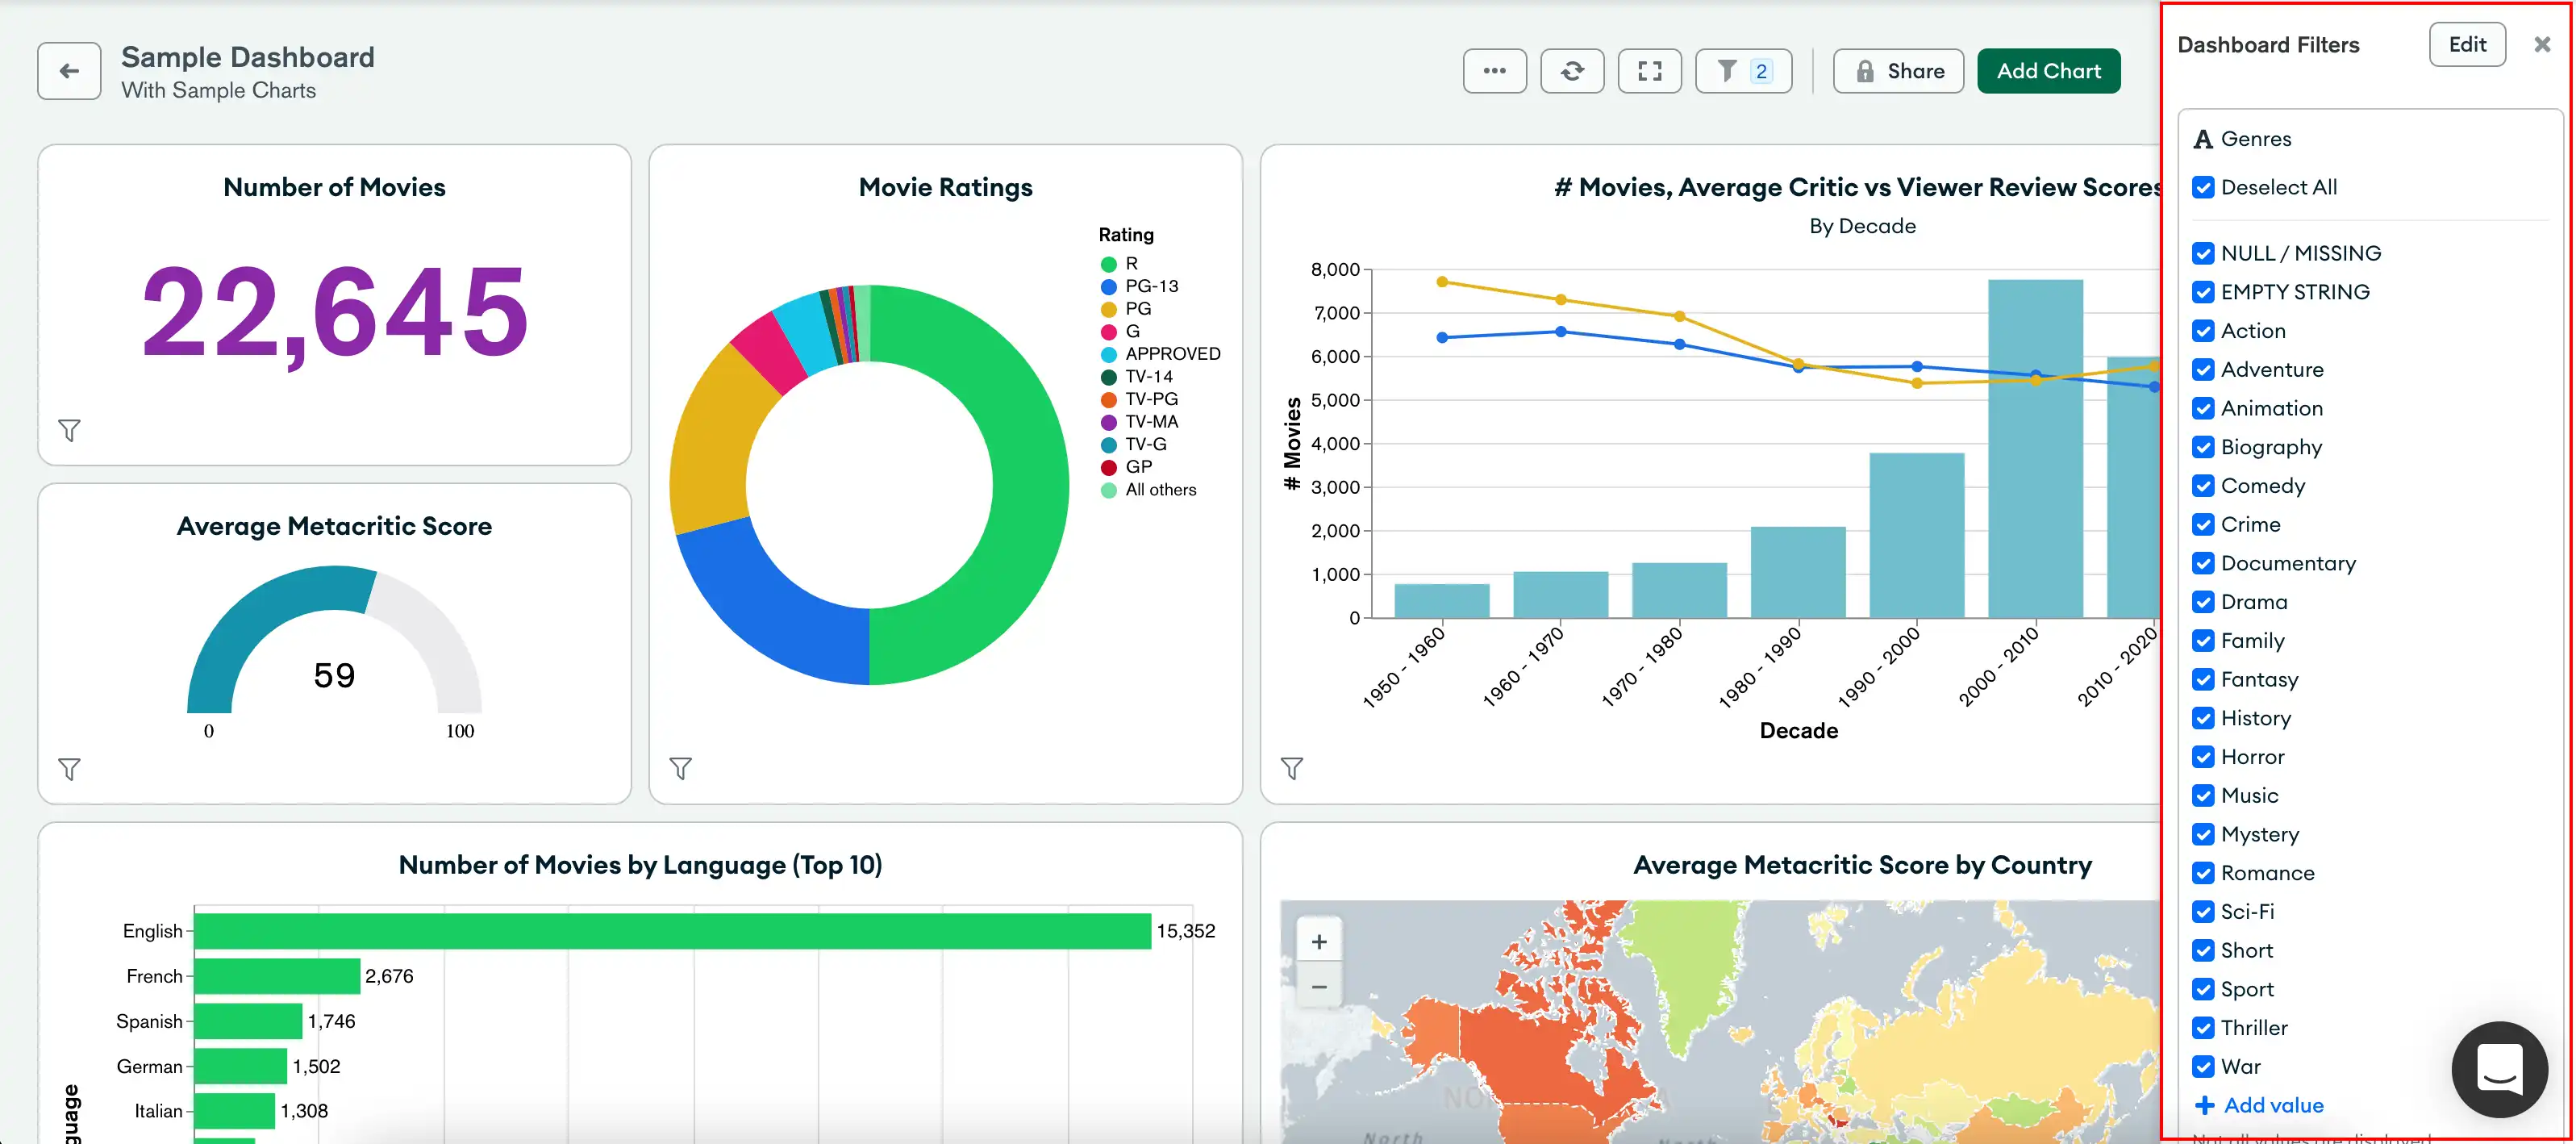
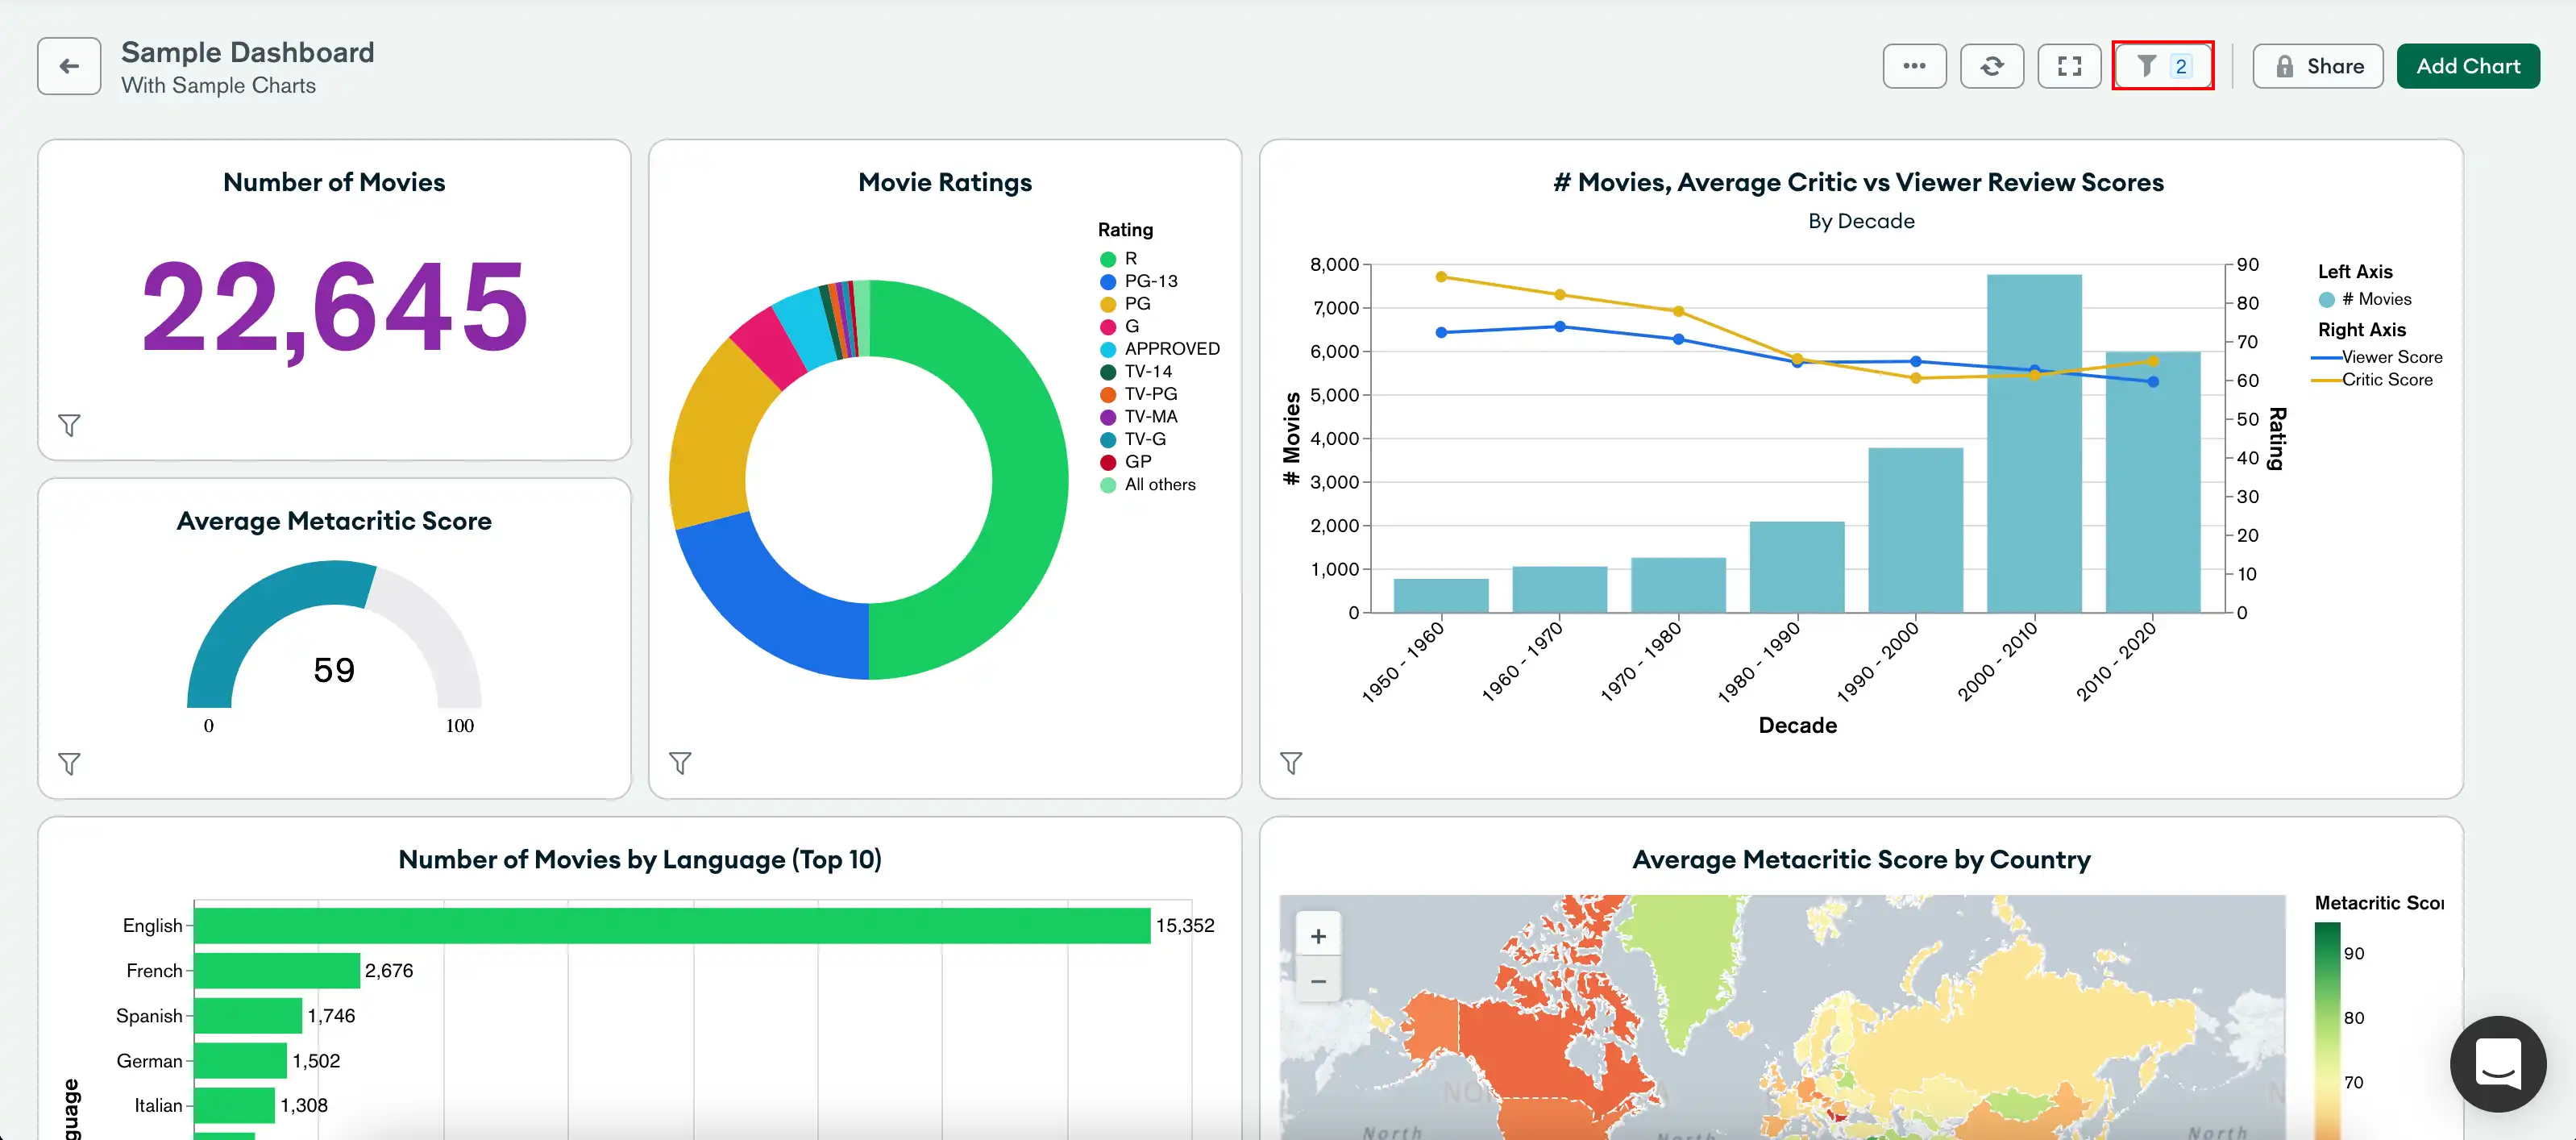
The Dashboard Filters icon indicates the number of active filters. Click the icon to expand the Dashboard Filters pane.

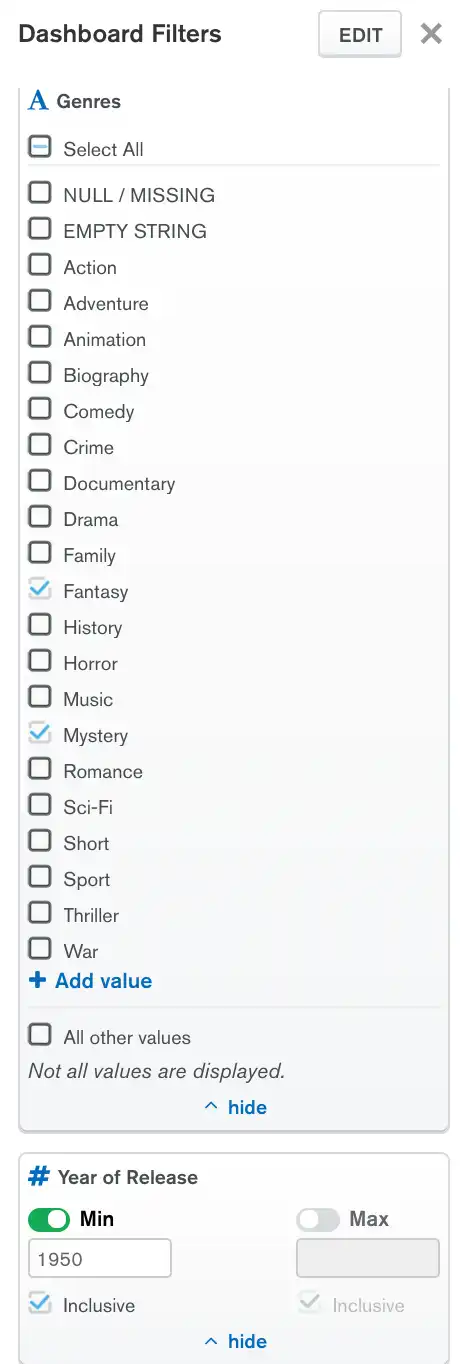
The Dashboard Filters pane displays a filter card for each field you can use to filter chart data. You can configure filter cards to use related fields from multiple data sources. When you update a field value, Charts updates dashboard charts to display data that matches the field values you provide from all configured data sources.
In the following example, a dashboard Author creates filters on
the genres and year fields from two sample movie datasets. The
Author sets default values for these fields to only display Science
Fiction and History movies released in or after 1968. Dashboard
Viewers can provide their own values for the filterable fields to
refine chart data based on their interests.

To learn about filtering options for each field data type, see Create Filters for Your Data.
Expand or Collapse Dashboard Filters
You can expand or collapse dashboard filter cards.
Disabled filters are automatically collapsed.
When enabled, collapsed filters still apply to your charts.
Manage Dashboard Filters
Dashboard Authors and Owners can:
Add, edit, and delete dashboard filters.
Disable dashboard filters on specific charts.
Add Dashboard Filters
You can specify fields that any dashboard users can filter data with. When you create a dashboard filter, you select related fields from the data sources that a dashboard chart uses. You can add dashboard filters based on any number of data sources that a dashboard chart uses.
Filter cards that use multiple data sources query each chart using the name of the field from the applicable data set.
Example
Chart A uses data set A. Chart B uses data set B.
Field A in data set A and field B in data set B
contain related information. You add both fields to a single
filter card.
When a filter affects chart A, the query for that chart uses
field A only. When a filter affects chart B, the query for
that chart uses field B only.
To add a dashboard filter:
Go to the Dashboards page.
For instructions, see Dashboards.
Select the desired dashboard.
Expand the Dashboard Filters pane on the desired dashboard.
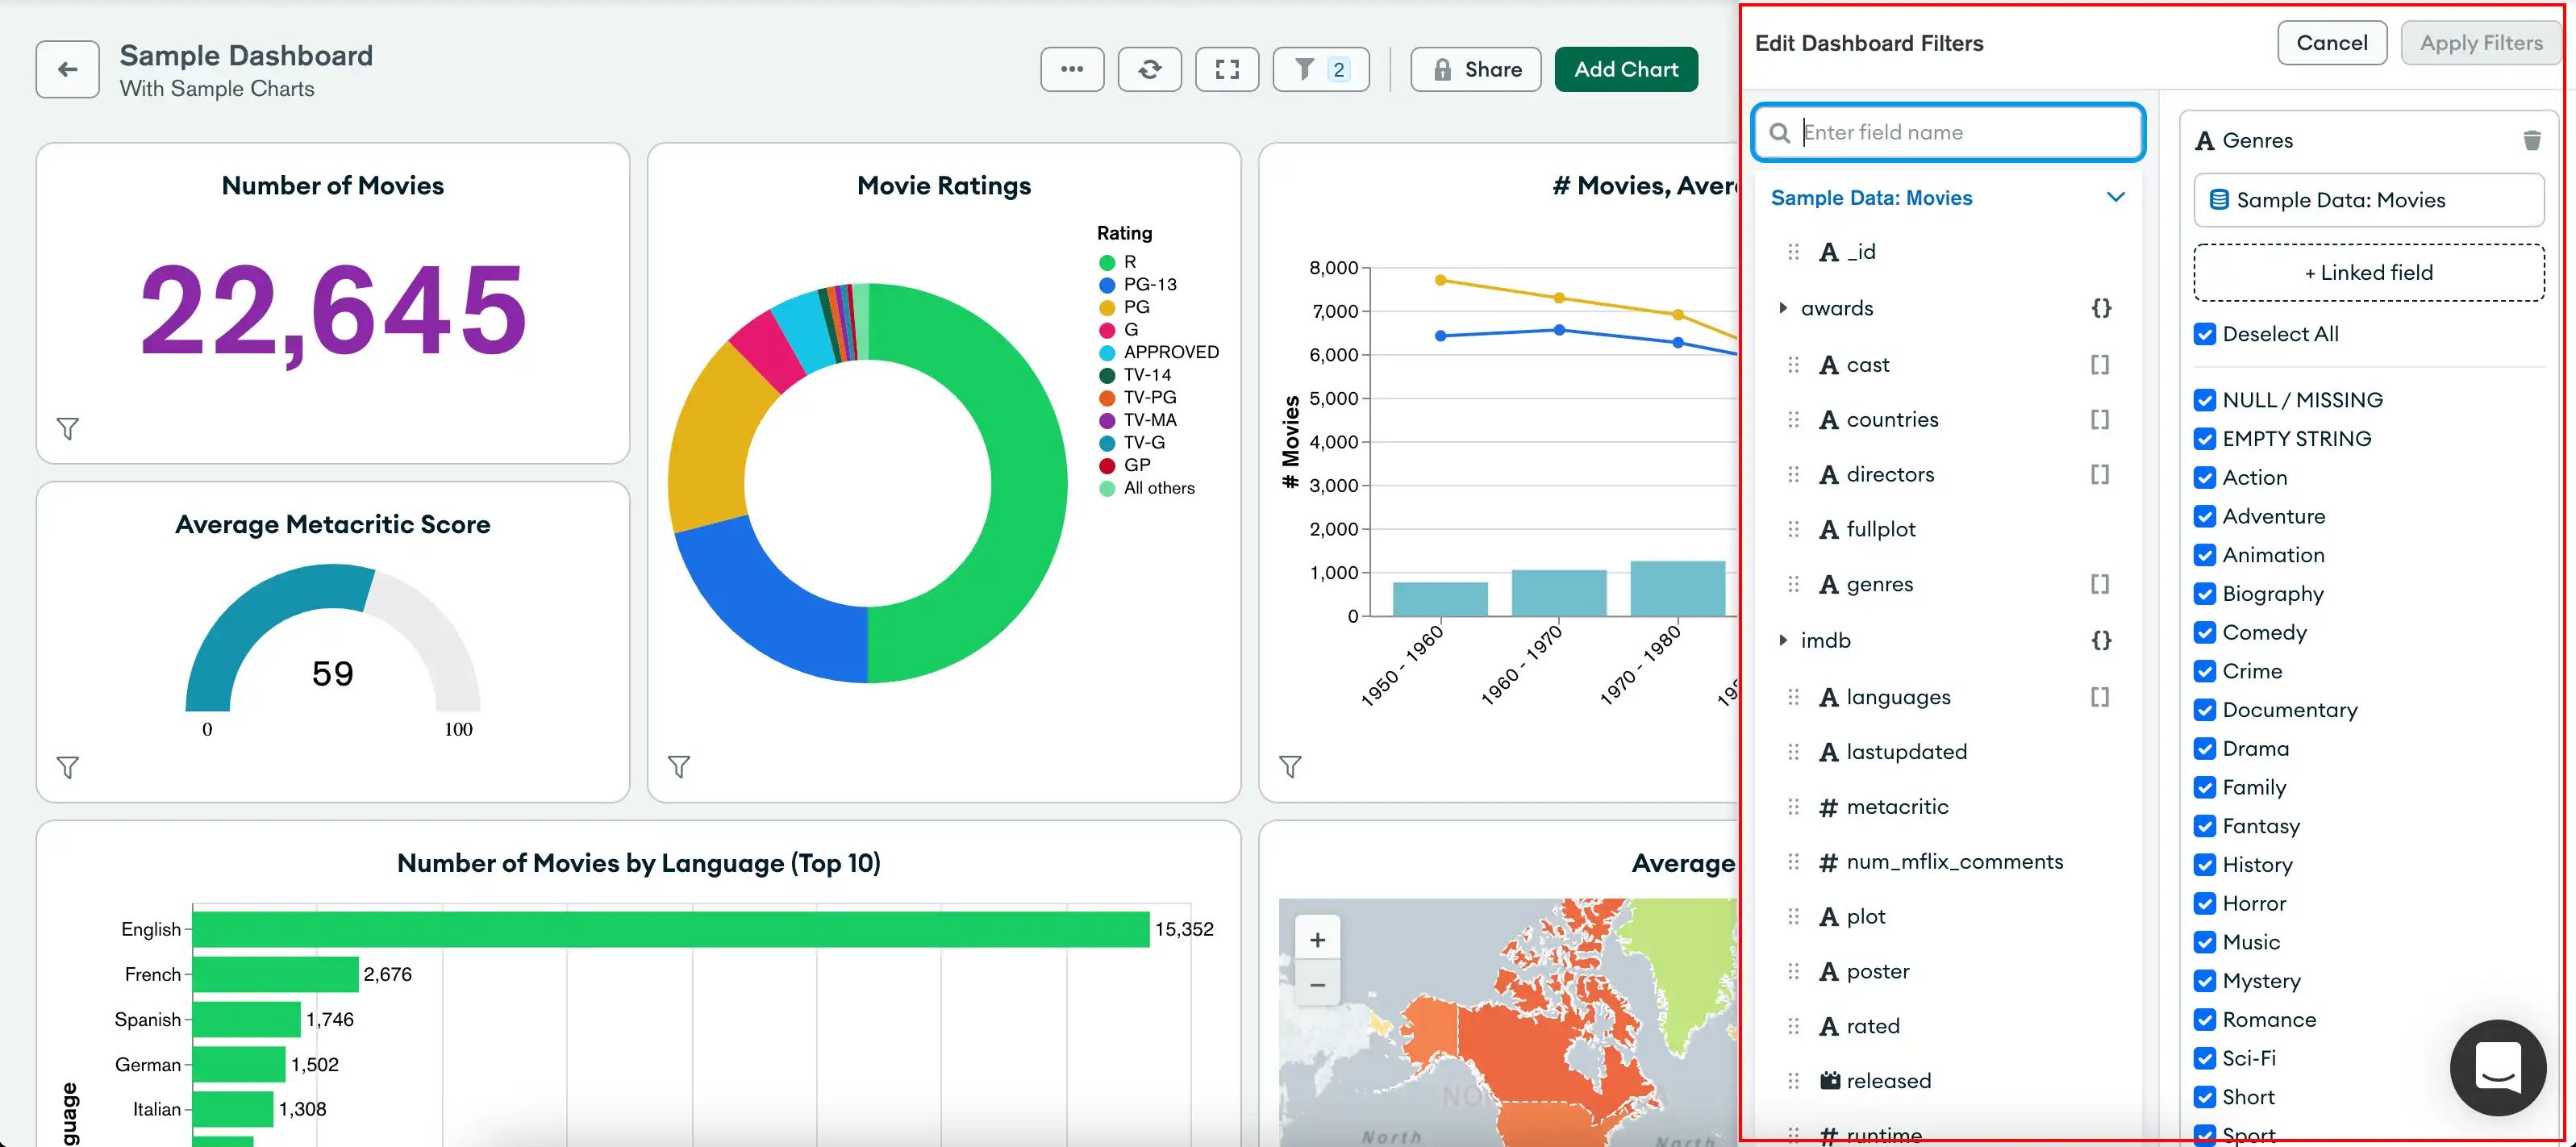
If a dashboard has no filters, click Add Filters. Otherwise, click Edit.
Expand a data source that contains fields you want to add a filter for.
Drag a field from the data source to the + filter drop zone.
Tip
To search for specific data fields, use the search bar at the upper left corner of the Edit Dashboard Filters pane.
The data source name appears below the field name in the filter card.
(Optional) You can stack fields from other data sources. This allows you to use a single filter to refine chart data from related fields from multiple data sources.
Note
To stack fields in a filter card:
Each field must be of the same data type as the other fields on the filter card.
The filter card must not have another field from the selected data source on it.
To stack fields from other data sources:
Expand another data source that contains a related field.
Drag a field from the data source to the + another field drop zone on the same filter card.
The data source name appears below the field name and the other data sources you selected fields from in the filter card.
Note
The field names might differ from each data source. The filter card lists the field name you used to create the filter.
Click next to a data source to remove its field from a filter card.
(Optional) Supply default values for the field in the filter card. All dashboard viewers see chart data that matches the default field values you provide until they provide their own filter values or disable the filter card.
The filter card options are based on the data type of the field. To learn about filtering options for each field data type, see Create Filters for Your Data.
Use the toggle to disable or enable the filter card by default. If disabled, each dashboard user must enable the filter card to display data the filter refines.
Repeat for each field you want users to filter data by.
Click Apply Filters.
Edit Dashboard Filters
After you create a dashboard filter, you can:
Rename filter cards.
Enable or disable filter cards.
Add or remove fields.
Stack fields from other data sources.
Change the default field values.

To edit a dashboard filter:
Go to the Dashboards page.
For instructions, see Dashboards.
Select the desired dashboard.
Expand the Dashboard Filters pane on the desired dashboard, then click Edit.
Make the changes you want to each filter card.
Click Apply Filters.
Delete Dashboard Filters
Go to the Dashboards page.
For instructions, see Dashboards.
Select the desired dashboard.
Expand the Dashboard Filters pane on the desired dashboard, then click Edit.
Hover of the filter card you want to delete, then click .
Click Apply Filters.
Disable Dashboard Filters for a Chart
You can disable filtering for a specific chart if you create at least one dashboard filter on the chart's data source. If you disable filtering, the chart is exempted from all dashboard filters and highlighting. The default selection for all charts is Filter or highlight.
To disable dashboard filtering for a chart:
Go to the Dashboards page.
For instructions, see Dashboards.
Select the desired dashboard.
Hover over the chart on the dashboard to reveal four buttons in the upper right corner of the chart.
Click the second button (for Interactive Filters) and select Ignore from the dropdown.
Note
You can't change this setting until you've created at least one dashboard filter on the chart's data source.
Once you ignore filtering, the Interactive Filters
button icon on the chart changes for all users. Users with the
Viewer role can also see a tooltip if they click the
Interactive Filters button,
which says "The dashboard owner has not enabled filtering for
this chart."
To reenable dashboard filtering for a chart:
Click the Interactive Filters button.
Select Filter from the dropdown.
Use Dashboard Filters
Any user with at least the Viewer role on a dashboard and the data
source backing a field can view the filter card and provide their own
values for the filter.
Filter Dashboards
You can filter the dashboard data based on the filterable fields
that an Author or Owner configured. Charts filters
data based on default field values if the dashboard Author or
Owner configured them. Dashboard Authors or Owners can
configure filter cards to use related fields from multiple data sources.
You can provide your own field values to customize the data the charts
display.
To filter dashboard data based on filterable fields:
Go to the Dashboards page.
For instructions, see Dashboards.
Select the desired dashboard.
Expand the Dashboard Filters pane on the desired dashboard.
If a filter card is disabled, click the toggle to enable it.
Modify the values of the provided fields to update the dashboard's charts based on the filter values you provided.
The filter card options are based on the data type of the field. To learn about filtering options for each field data type, see Create Filters for Your Data.
Note
If the filter card field is a
StringorObjectId, Charts only samples field values from the first data source that was added to the filter.The dashboard filter shows 20 sample values. If you want to add your own value, click + Add Value and enter the value.
Updating the filter value refines chart data based on all data sources linked to the filter card.
The charts refresh immediately after you modify a field value.
Revert Dashboard Filters to Default Values
To revert a filter card to its default values, click .