Encoding channels are the building blocks of your visualizations. These channels are the means by which Charts translates data from your collection to the visualization. The encoding process dictates how that data appears in the chart based on the channel type selected.
Encoding Channel Types
Each encoding channel type provides different capabilities for
processing and visualizing your data. Each channel type accepts
distinct data types (e.g., string versus numeric
data). The following table describes each encoding channel type in
Atlas Charts:
Encoding Channel Type | Description |
|---|---|
Value | A point on the chart is created from the chosen field for each
document in the collection. You may only assign fields with a
|
Category | Each unique value from this field in the collection is used as a chart category. The Category encoding channel provides the following additional visualization options:
|
Aggregation | A point on the chart is created by applying an aggregation function over the values of this field from multiple documents. For more information on using aggregation functions in Charts, see Aggregation Options. |
Geopoint | When you create a chart using a geopoint channel type, Atlas Charts renders a map to visualize your data. A mark is plotted on the map for each document containing the selected field based on the field's latitude and longitude values. Geopoint channel types are used in the Coordinates channel on Geospatial Scatter and Geospatial Heatmap chart types. For more information on the geopoint encoding channel type, refer to the Geopoint Channel Type section. |
Charts shows required encoding channels in green, and optional encoding channels in blue.
Aggregation
Dragging a field onto an aggregation encoding channel allows you to use an aggregation pipeline operator on that field.
For a list of the available aggregation pipeline operators in Charts, see Aggregation Options.
Example
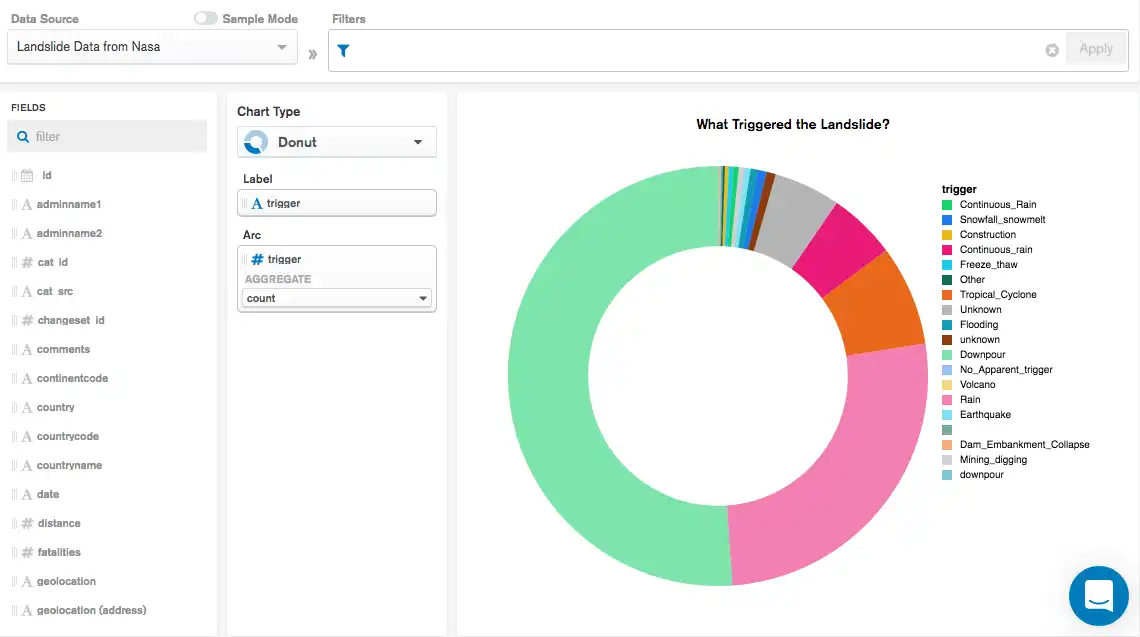
Donut charts provide two encoding channels:
A category channel called Label dictating which field to use when dividing the sections of the chart.
An aggregation channel called Arc dictating the aggregation operation to perform on the Label category.
The following donut chart examines NASA's Landslide data source to
show the frequency of various landslide triggers by performing a
$count aggregation
on the trigger field:

We see from the chart that the most common landslide trigger is
Downpour followed by Rain.
Geopoint Channel Type
Geopoint channel types are used in the Coordinates channel on Geospatial Scatter and Geospatial Heatmap chart types. Geospatial charts visualize data that references specific geographic locations.
Atlas Charts automatically determines which fields in your dataset, if any, are GeoJSON Points. Charts signifies these fields with a icon. You can map these fields directly to a geopoint channel type by dragging them onto an appropriate geopoint channel type in the chart builder. Charts automatically determines the latitude and longitude values from the field and adds a point to the map for each document.
Note
You can also assign numeric coordinates or arrays to a geopoint channel type to specify latitude and longitude not stored as GeoJSON Points. For details on this process, see the following section.
Assign Non-GeoJSON Fields to a Geopoint Channel Type
This section describes how to use fields not stored as GeoJSON Points in a geopoint channel type.
You can drag numeric fields onto a geopoint channel type to specify latitude and longitude. When you drag a numeric field onto a geopoint channel type, the channel updates to use the selected field as either Latitude or Longitude. Charts prompts you for a second numeric field to fill in the other value.
Alternatively, you can drag a numeric array onto a geopoint channel type to specify location coordinates from a field. When you use this approach, you can specify which indexes of the array to use for latitude and longitude components.
For additional information and examples on Geospatial Scatter and Heatmap charts which utilize geopoint channel types, refer to the relevant chart type pages.
Add Missing Fields in the Chart Builder
Atlas Charts populates the Fields pane of the chart builder by randomly sampling documents from the selected data source. As a result, Charts might not display all fields from documents in the data source if the field is not present on all documents.
To add a specific field in the chart builder:
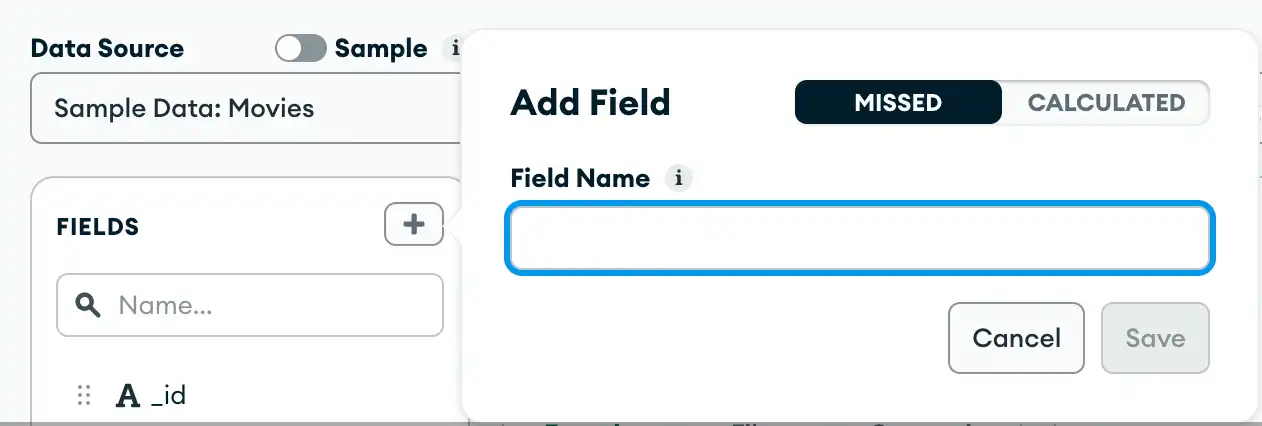
In the corner of the Fields pane, click Add Field.
Make sure that the default Missed field type is selected.
Enter the Field Name of the field you want to add.
Note
You can specify a nested field by using dot notation. For example, you can specify
address.neighborhood.Click Save Field.

After Atlas Charts locates the missed field, the field appears in italics the Fields pane. If Atlas Charts discovers other missed fields in the same subdocument, Atlas Charts also adds those fields in italics. Once you add a field, you can include it in your chart, convert its data type, or remove it.