Filters display a subset of results that match a given criteria. Atlas Charts provides two ways to filter the data for a single chart. You can either use:
The Filter Tab's numeric, string, date, or boolean fields to handle most of your data filtering needs.
The Query Bar to filter your data using more complex queries, such as logical operator queries, or process raw data by using the aggregation pipeline.
To learn how to filter results across multiple charts on your dashboard, see Filter Dashboards by Field Values.
Create Filters for Your Data
The chart builder contains a filter tab where you can drag and drop fields to specify filters for your data. To filter data using the filter tab:
Click the center tab in the chart builder:
![Image showing how to access filter tab]()
Drag a field from the Fields on the left to the Chart Filters section of the tab.
The data type of the selected field determines the available filtering options. You can filter fields with the following data types:
When you drag a numeric field to the filter panel, you can filter based on minimum and/or maximum values for that field.
To specify a minimum value: | To specify a maximum value: |
|---|---|
|
|
Example
If you have a minimum value of 5 with the Inclusive
setting on, Atlas Charts shows documents where the field is greater than
or equal to 5.
Alternatively, if Inclusive is off, Atlas Charts shows
documents where the field is greater than 5.
When you drag a string or ObjectId field to the filter panel, Atlas Charts displays a list of up to 20 distinct field values. If more than 20 distinct values exist, Atlas Charts displays 20 randomly selected values.
The list also includes:
NULL / MISSING for documents with
nullvalues for the field or are missing the field.Empty String for documents with
""values for the string field. (String fields only.)
Select the values to display in the chart. By default, all values are selected.
Tip
If all values are selected, you can click Deselect All at the top of the list to hide all values.
If not all values are selected, you can click Select All to return to the default state of having all values displayed.
Display Strings and ObjectIds Not in the List
To display a specific value not included in the list, add the value by clicking Add Value.
Important
For ObjectId fields, the value you input must be a well-formed ObjectId, or else Atlas Charts does not accept the value.
To display all other values not included in the list, check All other values.
When you drag a date field to the filter panel, you can filter based on a specified date range. This range can either be:
A relative date range, which specifies a range relative to the time the chart is rendered (e.g., the last six months).
A date range based on the current time when the chart is rendered, with a choice of periods.
An absolute date range, which is a range between specific begin and end dates.
Select the appropriate tab for more information on the date filter:
Relative date filters specify a range relative to the time the chart is rendered. To define the date range, specify a period of time in the past and/or a period of time in the future relative to the current date. Relative is the default date filtering option.
To set a lower bound for the date filter: | To set an upper bound for the date filter: |
|---|---|
|
|
Example
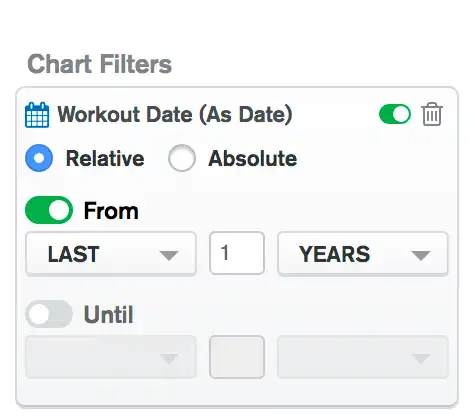
The following relative date filter only shows documents
with a Workout Date (As Date) field that is more recent than one year
ago from the current date:
Period date filters specify a range relative to the current time when the chart renders. To define a period date range, select Period at the top of your date filter card.
Period options include:
Hour from the top of the hour
Day from midnight
Week from midnight Sunday
Month from midnight on the 1st of the month
Year from midnight on the 1st of January
The Period date filter also has usage options. Together with the period, the usage options let you define an exact window of time in the past, present, or future.
Period usage options include:
Direction. You can select Previous to show past periods or Next to show future periods.
Count. You can set the number of periods to display.
Include Current Period. You can include the current period in the specified time window.
Period usage options work together. The data that Atlas Charts displays for the Month period depends on the direction, count, and Include current period selection.
Atlas Charts counts the number of periods you specify backwards (for Previous) or forwards (for Next). Counting starts at the beginning of the current period (with Include current period selected), or the beginning of the last completed period (without Include current period selected). Atlas Charts displays the data from the beginning of the selected period(s) through the end of the selected period(s).
Example
If today is December 8 and you set a period date filter on
released with the following selections:
Previous
3Months, and
Include current period selected
Atlas Charts would show documents with a released date from October 1 of this year to December 31 of this year, including the start and end dates.
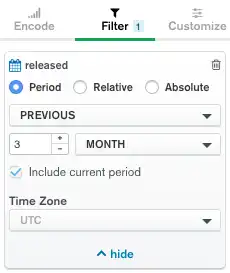
However, if you set the same filter without selecting Include current period, Atlas Charts would show documents with a released date from September 1 of this year to November 30 of this year, including the start and end dates.
To set a Period date filter:
Select a period direction from the first dropdown menu.
Enter a numeric value for the period count in the text entry field. You can enter whole numbers or decimal values.
Choose a period the next dropdown menu.
(Optional) Deselect Include current period to exclude the current period. Include current period is the default selection.
Absolute date filters use absolute dates to define their upper and lower bounds. To define an absolute date range, select Absolute at the top of your date filter card. By default, the dates specified in the filter are assumed to be in UTC, matching the raw data in the collection. You can specify a timezone for your filter to adjust the date values as desired.
To set a lower bound for the date filter: | To set an upper bound for the date filter: |
|---|---|
|
|
Note
The date and time formats used in your bounds depend on your location, as determined from your browser settings.
Example
The following absolute date filter only shows documents
with a Workout Date (As Date) field from the year
2018:
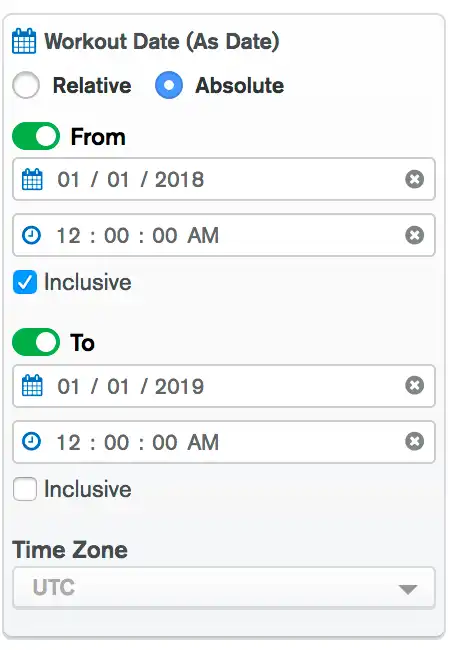
The filter returns all documents with a
Workout Date (As Date) field from January 1, 2018 12:00:00
AM inclusively, to January 1, 2019 12:00:00 AM exclusively.
Specify a Time Zone
Use the Time Zone dropdown at the bottom of the filter card to specify a time zone for your absolute date filter.
By default, MongoDB stores date values in UTC. When you change the time zone, Charts modifies your date values with respect to the selected time zone. As a result, different documents may be returned by your absolute date filter depending on the time zone selected.
Example
Consider an absolute date filter which spans from January 1, 2018 12:00:00 AM inclusively to January 1, 2019 12:00:00 AM exclusively. By default, a document with a UTC date of January 1, 2019 2:00:00 AM would not be included in this date range. However, if we adjust the time zone to Central America (UTC-06:00), this document would be returned because the adjusted date is December 31, 2018 8:00:00 PM.
You can filter the chart data based on the boolean value of a specific field. Drag a boolean field to the filter panel to view the available options:
True displays documents where the field value is
true.False displays documents where the field value is
false.NULL / MISSING displays documents where the field is
nullor does not exist.
All options are selected by default. The chart preview updates as you modify the selected options. Deselecting all options renders a blank chart.
Example
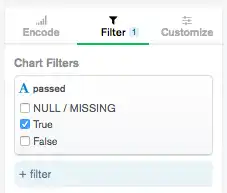
A chart using the following filter only displays documents where the
passed field is true. The chart does not display documents
where the passed field is false, null, or does not
exist.
Note
You cannot use the same field in multiple filters.
Enable or Disable a Filter
You can toggle whether a filter in the Filter tab is enabled or disabled. Disabled filters do not affect the documents which appear in the chart. Disabled filters are grayed out and cannot be edited until they are enabled.
To toggle whether a filter is enabled, hover over a filter and set the toggle that appears at the top of the filter to the desired setting.
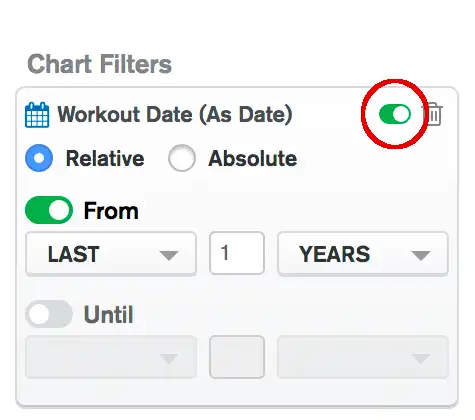
Expand or Collapse a Filter
You can expand or collapse chart filter cards by clicking Show or Hide on that card.
Disabled filters are automatically collapsed.
Enabled, collapsed filters are still applied to your charts.
Filter Your Data Using the Query Bar
The Query bar above the chart display supports more complex queries than the filter panel. Additionally, you can use the query bar to create aggregation pipelines to process your data before it is rendered.
To filter data using the Query bar:
In the Query bar, input a filter document. Use the same syntax used in the query portion of the db.collection.find() method. Your filter document must be in curly brackets.
Click Apply.
The following tabs show how to construct queries with the following operators:
$orlogical operator to match documents where at least one clause is true$existsquery operator to match documents with an element that exists$regexquery operator to match documents with a regular expressionDatefield to match documents with specific dates
The following chart shows the top 5 countries (Limit Results under the X Axis was enabled and set to 5) in terms of the number of directors who have made either a documentary or a biography film.
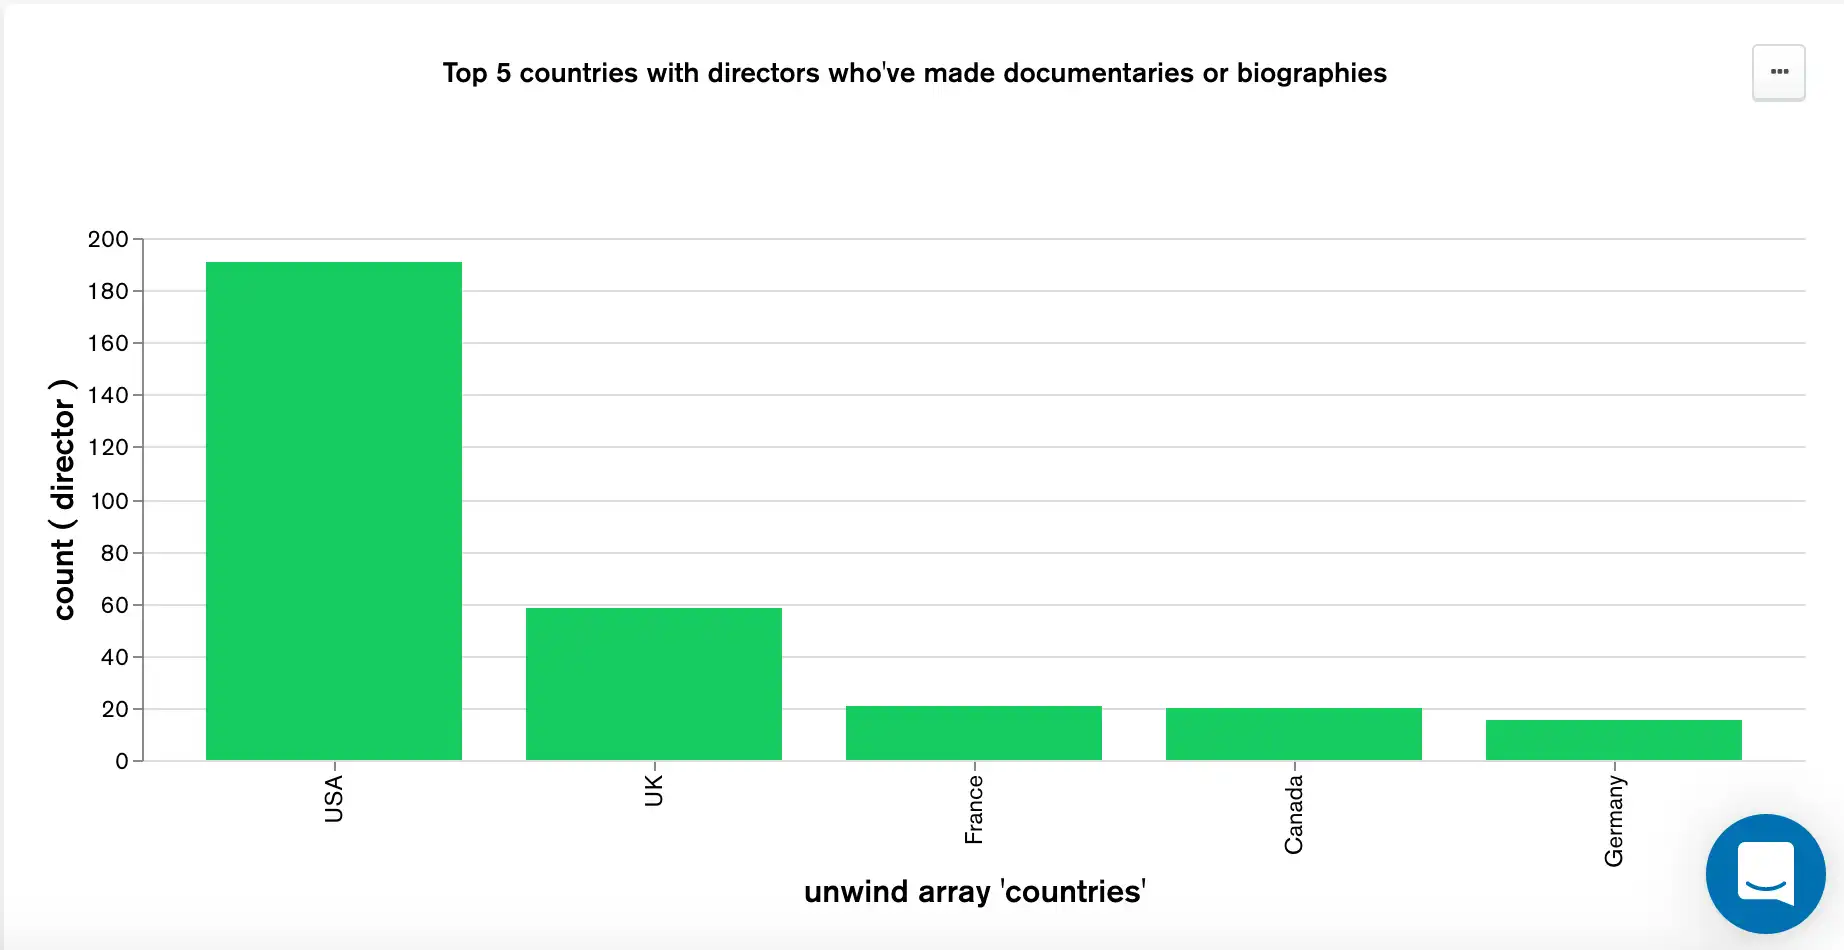
The chart uses the following query:
{ $or: [ { genres: "Documentary" }, { genres: "Biography" } ] }
genres is an array where each element is a film genre. This filter ensures that only directors who
have made either a documentary or a biography film are included in the total count of directors for a
particular country.
The following chart shows the average Metacritic ratings of movies over time binned by 5 year periods.
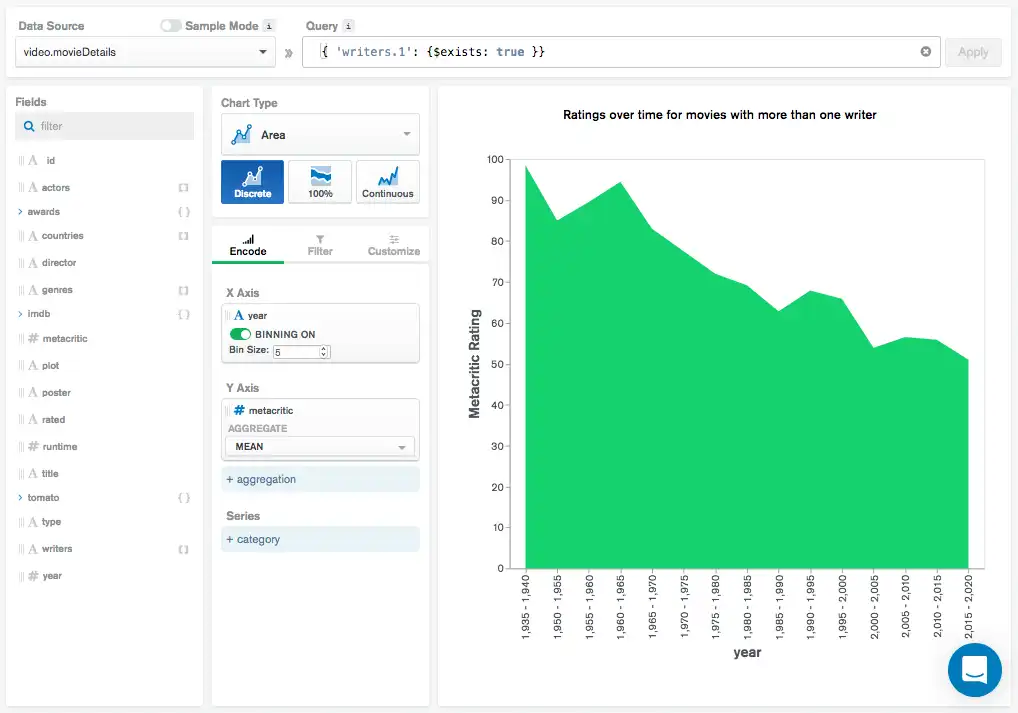
The chart uses the following query:
{ 'writers.1': { $exists: true }}
writers is an array where each element is a writer who
contributed to the movie. This filter ensures that only documents with
at least two writers are factored into the mean Metacritic rating by
checking that the second array element exists.
Use the $regex query operator to filter using a
regular expression:
{ <field>: { $regex: "pattern", $options: "<options>" } }
For example, to find all documents where the jobs field begins with
the letter A, you would write the following in the
Query bar:
{ "jobs" : { $regex : "^A" } }
To find all documents where the jobs field begins with the
letter A or a, you would write the following in the
Query bar:
{ "jobs" : { $regex : "^A", $options : "i" } }
The following chart shows total sale amounts from an office supply company, categorized by purchase method:
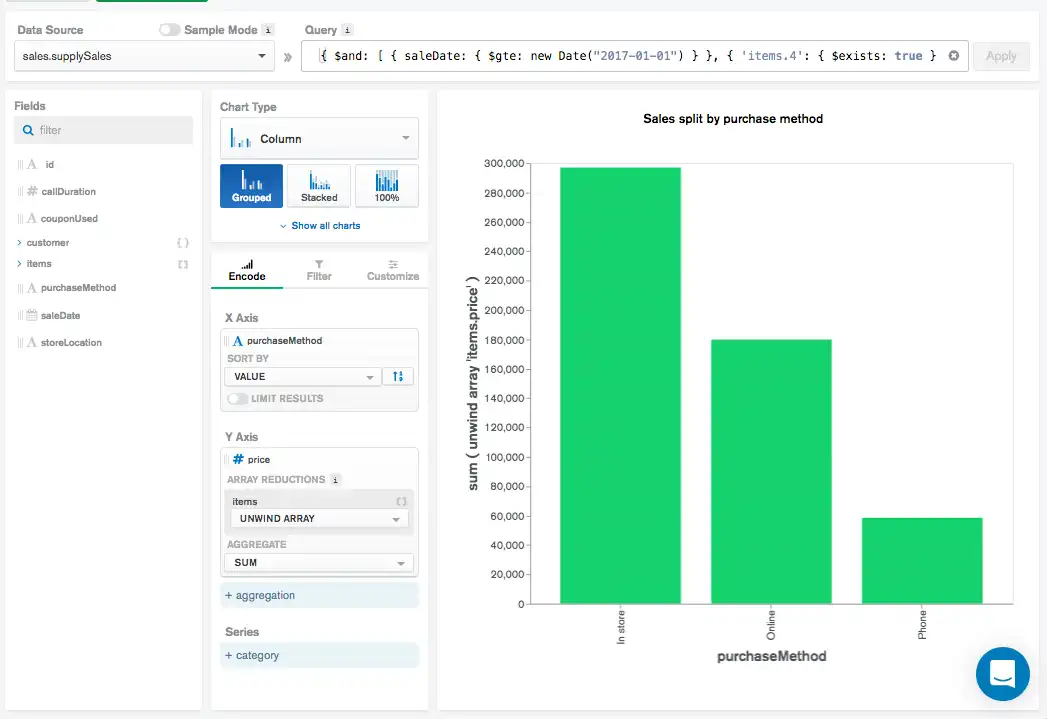
The chart uses the following query:
{ $and: [ { saleDate: { $gte: new Date("2017-01-01") } }, { 'items.4': { $exists: true } } ] }
Each document in the collection represents a single sale. items is
an array where each element is an item purchased during a sale.
This query restricts the documents shown to only those with
a saleDate equal to or more recent than January 1, 2017 with at
least 5 elements in the items array.
Address Query Errors
If your query is invalid, Charts displays the icon in the Query bar.
Click the Query bar if it is not already displayed to view error details. Charts displays error details for:
Client-side errors, such as malformed JSON, and
Server-side errors, such as invalid MQL.

Review the error details, then adjust your query accordingly.
Considerations
Filters on large collections may encounter performance issues if the collection is not appropriately indexed.
The date functions used in the Atlas Charts query bar are consistent and compatible with the date functions used in the mongo shell. As a result, you can use:
new Date(),ISODate(), ornew ISODate().
The
Date()function (as opposed to thenew Date()constructor) returns the current date as a string, so it cannot be used for querying dates in Charts.
