大規模な組織では、クラウド費の追跡と管理が困難になる場合があります。 のコスト節約構成は支払いを積極的に管理するのに役立ちますが、Atlas は 支出を表示および分析する ためのツールも提供します。ここでは、次の作業が可能です。
組織の請求ニーズに基づいて Atlas リソースを分類。
請求 データを活用して、Atlas の支出を視覚化して理解します。
請求データをプログラムで取得し、FinOps ツールと統合して、各部門およびアプリケーション内でのチャージバックや会計処理を行うために使用。
このページでは、組み込みの Atlas ツールと Atlas 請求データを使用してクラウド費を追跡する方法を学びます。
Apply Resource Tags
Atlas でリソースタグを適用することにより、部門、プロジェクト、またはコストセンターに応じてリソースを分類し、正確なコスト配分を行うことができます。また、財務レポートでタグ付けされたリソースをグループ化して分析することで、さまざまなチームやプロジェクトがクラウド全体の支出をどのように構成しているかを明確かつ整理された形で表示できます。詳細については、 リソースタグをご覧ください。
プログラムによる請求データへのアクセス
Atlas Administration API は、外部ツールやレポートで使用するための請求データに、プログラムでアクセスできる RESTful インターフェースを提供します。この機能をリソースタグと組み合わせることで、Atlas の支出を簡単に分類できます。
1 つの組織のすべての保留中の請求書を返すAPI ポイントを使用して、すべての保留中の請求書を検索できます。エンドポイント レスポンスの本文には、リソース(組織やクラスターなど)に適用したタグを反映する results.lineItems.tagsフィールドが含まれています。次に、この明細項目レベルの請求データを外部の FindOps ツールにフィードし、環境、チーム、またはその他のタグ値ごとに Atlas の支出を追跡できます。
組織間請求を有効化
Atlas を使用すると、多くの組織間で請求サブスクライブを共有し、それらに対して単一の請求書を支払うことができます。組織横断請求を有効にすると、すべての組織の Atlas の支出を簡単に確認できます。
支払い側組織を設定 したら、リンクされたすべての組織で発生した料金のリストを含む支払い側組織の請求書を支払います。詳しくは、「 組織横断請求 」を参照してください。
組織横断請求を有効にすると、支払い組織の Organization Billing Admin ロールまたは Organization Owner ロールを持つ場合、リンクされた請求書を表示できます。
月額コスト可視化の確認
請求データを毎月表示するには、Cost Explorer ページに移動します。Cost Explorer では、クラウド支出をチャートや表形式で粒度のあるビューが提供され、ユーザーはクラスター、プロジェクト、またはチームごとのコストを分析できます。過去の支出データとカスタマイズ可能な フィルター は、傾向や非効率を識別し、財務上の決定とリソースの最適化を改善するのに役立ちます。過去 6 か月間の使用量を表示したり、過去 18 か月までの請求データにアクセスしたりできます。組織横断請求を使用している組織では、リンクされているすべての組織の請求データを表示できます。
Billing Cost Explorer は、使用状況データを組織、プロジェクト、 クラスター、およびサービスごとにフィルタリングしてグループ化します。各フィルターには、各月に発生した合計コストを表す積み上げ縦棒グラフを含む Usageチャートが含まれています。その下には、チャートに表示されている請求データを表示する Usage By Month テーブルがあります。詳しくは、「 Billing Cost Explorer 」を参照してください。
年間コスト可視化の確認
請求データを年間で表示するには、Billing Overview ページに移動します。このページは、組織の Atlas の使用に関連するコストをサービス、配置、プロジェクトごとに理解するのに役立ちます。各カテゴリには、各月に発生した合計コストを表す積み上げ縦棒グラフを含む Usageチャートが含まれています。詳細については、「 年初来の使用状況チャート 」を参照してください。
請求書コスト可視化の確認
請求データを請求書として表示するには、表示したい Invoice Date または Invoice Period をクリックします。このページでは、Total Usage チャートと By Deployment チャートを通じて請求期間中に Atlas の使用によって発生するコストが表示されます。
Total Usageチャートでは、使用状況をサービス別にフィルターして、特定の Atlas サービスによって発生した料金を表示できます。By Deploymentチャートでは、すべてのプロジェクトにわたる各クラスターで発生した使用量の割合を表示できます。
明細項目請求額を確認するには、「 過去の請求書の表示と支払い 」を参照してください。
請求ダッシュボードの作成
MongoDB Charts 請求ダッシュボードで請求データを視覚化すると、Atlas の支出を最適化できます。請求ダッシュボードには、事前に構築されたチャートが含まれており、組織内での Atlas の使用状況をさまざまなカテゴリや期間にわたって監視することができます。MongoDB Charts は Atlas と統合して請求データをシームレスに取り込みます。

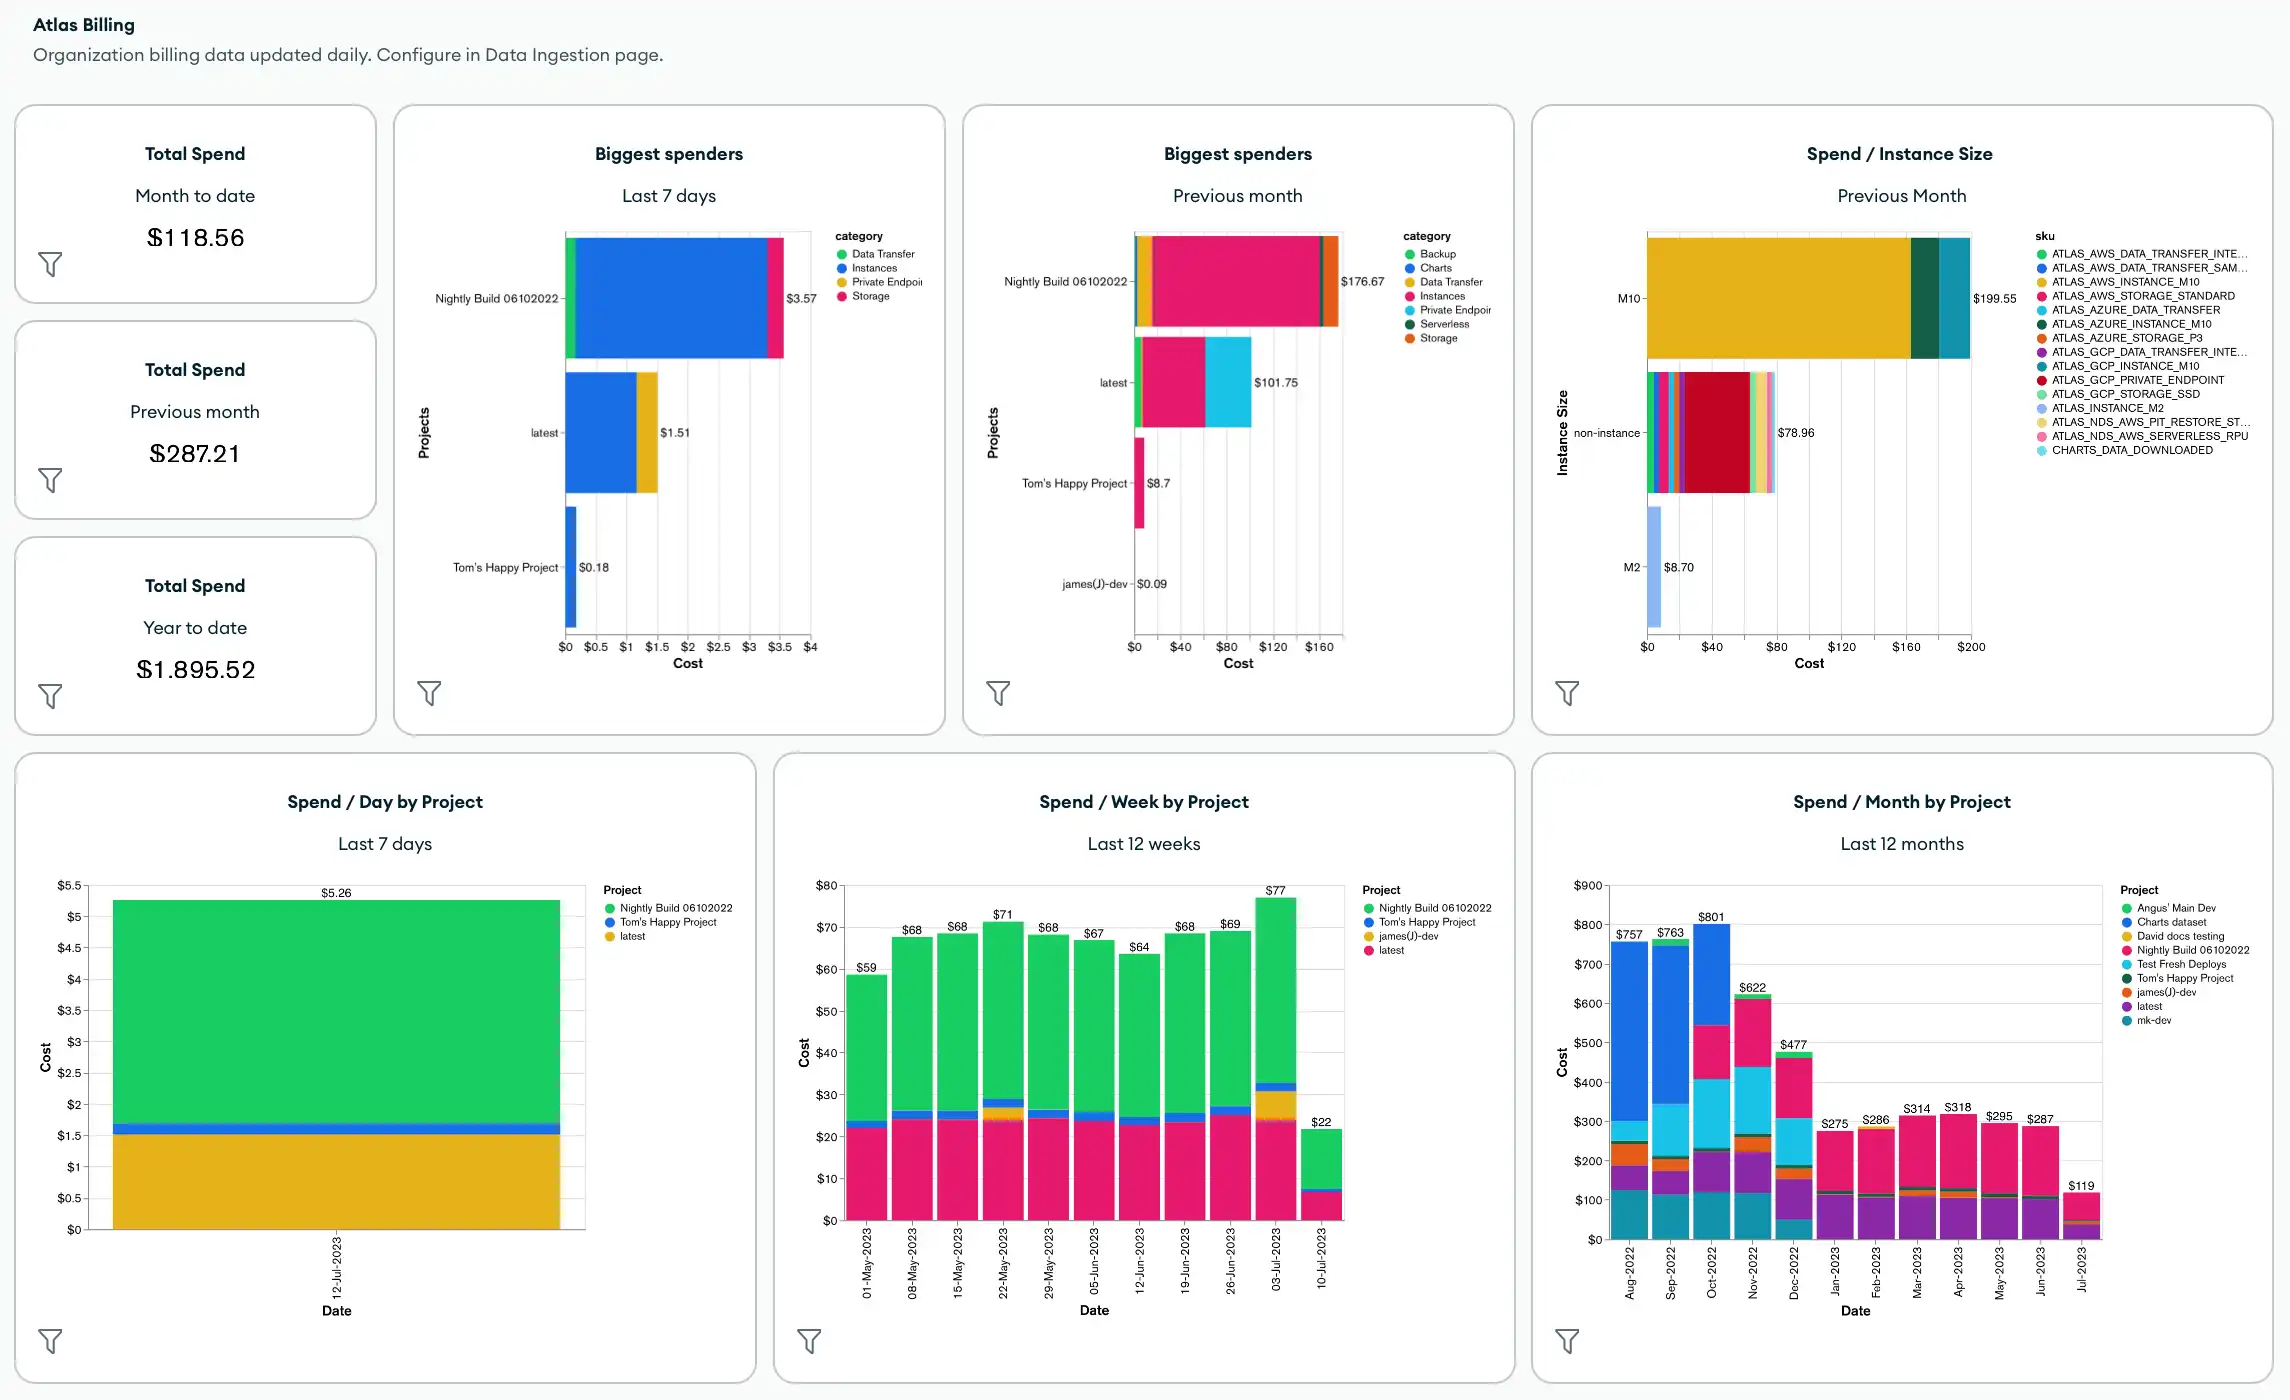
デフォルトでは、請求ダッシュボードには以下のメトリクスとチャートが含まれます。
組織全体の総売上額
組織内で最大の支出
インスタンス サイズ、プロジェクト、クラスター、製品カテゴリ、SKU 別の合計費用
製品カテゴリ別の合計コスト
また、ダッシュボード フィルターを適用し、請求データに適用したタグを使用するチャートを含め、新しいチャートを追加して、請求ダッシュボードをカスタマイズすることもできます。
請求ダッシュボードを作成または管理するには、「請求ダッシュボードの作成と管理」を参照してください。