Performance Best Practices: Benchmarking
Welcome to the final part in our series of blog posts covering performance best practices for MongoDB.
In this series, we have covered considerations for achieving performance at scale across a number of important dimensions, including:
- Data modeling and sizing memory (the working set)
- Query patterns and profiling
- Indexing
- Sharding
- Transactions and read/write concerns
- Hardware and OS configuration
Last up is benchmarking.
Generic benchmarks can be misleading and mis-representative of any technology and how well it will perform for a given application. We instead recommend that you model your benchmark using the data, queries, and deployment environment that are representative of your application. The following considerations will help you develop benchmarks that are meaningful.
Use Multiple Parallel Threads
Especially for a sharded cluster, and certain configurations like writeConcern majority, latencies for a single operation can be significant, and using multiple threads is necessary to drive good throughput.
Use Bulk Writes
Similarly, to reduce the overhead from network round trips, you can use bulk writes to load (or update) many documents in one batch.
Create Chunks Before Data Loading
When creating a new sharded collection, pre-split chunks before loading. Without pre-splitting, data may be loaded into a shard then moved to a different shard as the load progresses. By pre-splitting the data, documents will be loaded in parallel into the appropriate shards. If your benchmark does not include range queries, you can use hash-based sharding to ensure a uniform distribution of writes and reads.
Consider the Ordering of Your Shard Key
If you configured range based sharding, and load data sorted by the shard key, then all inserts at a given time will necessarily have to go to the same chunk and same shard. This will void any benefit from adding multiple shards, as only a single shard is active at a given time.
You should design your data load such that different shard key values are inserted in parallel, into different shards. If your data is sorted in shard key order, then you can use hash based sharding to ensure that concurrent inserts of nearby shard key values will be routed to different shards.
Disable the Balancer for Bulk Loading
Prevent the balancer from rebalancing data unnecessarily during bulk loads to improve performance.
Prime the System for Several Minutes
In a production MongoDB system the working set should fit in RAM, and all reads and writes will be executed against RAM. MongoDB must first read the working set into RAM, so prime the system with representative queries for several minutes before running the tests to get an accurate sense of how MongoDB will perform in production.
Use Connection Pools
Re-opening connections for each operation takes time, especially if TLS is used. Review connection pool options in the documentation.
It is also important to configure ulimits.
Monitor Everything to Locate Your Bottlenecks
Whether running a benchmark or production workload, it is important to monitor your deployment. We covered query and index profiling in parts 2 and 3 of this blog series using tools like the explain plan, MongoDB Atlas Data Explorer, and Compass. These tools also provide fine-grained telemetry and observability across all components of your database cluster.
MongoDB Atlas features charts, custom dashboards, and automated alerting, tracking 100+ key database and systems metrics including operations counters, memory, and CPU utilization, replication status, open connections, queues, and any node status.
The metrics are securely reported to Atlas where they are processed, aggregated, alerted, and visualized in a browser, letting you easily determine the health of MongoDB over time. Ops Manager, available as a part of MongoDB Enterprise Advanced provides the same deep monitoring telemetry when running MongoDB on your own infrastructure.
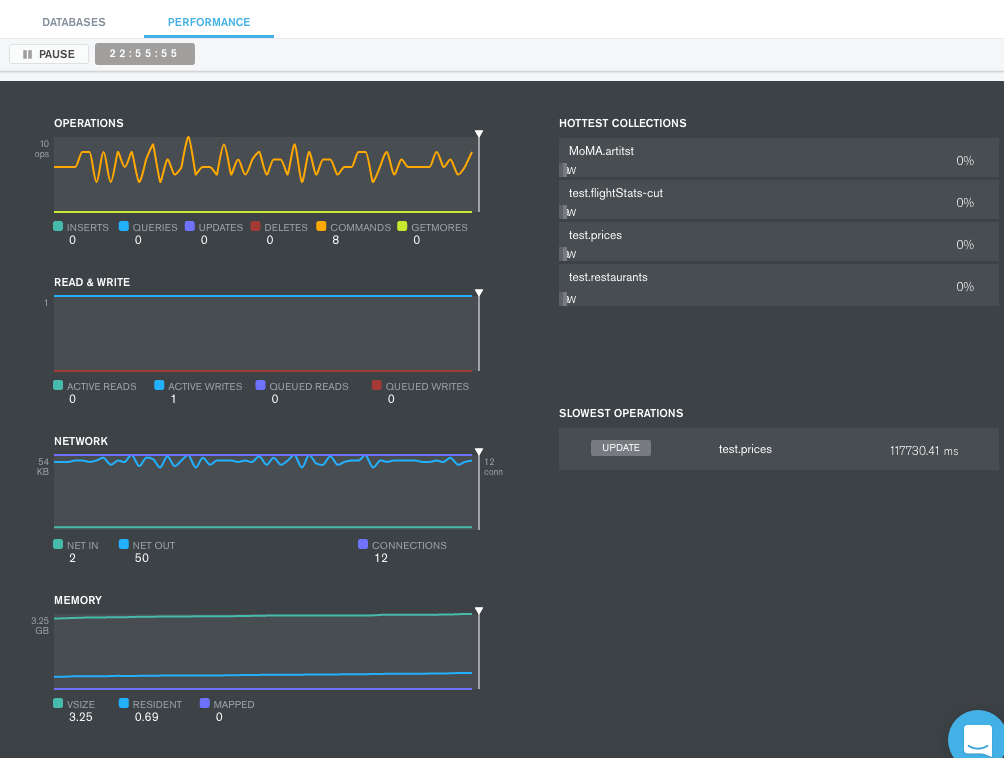
For instant visibility into operations, the Real-Time Performance Panel (RTPP) monitors and displays current network traffic, database operations on the machines hosting MongoDB in your clusters, and hardware statistics about the hosts.

Free Monitoring Service
If you are running MongoDB in your own environment, the Free Monitoring cloud service is the quickest and easiest way to monitor and visualize the status of your MongoDB deployment.
You don’t need to install any agents or complete any forms to use the service. Free monitoring collects a range of metrics including operation execution times, memory and CPU usage, and operation counts, retaining the data for 24-hours.
Basic Proof of Concepts
If you just want to evaluate different Atlas tiers or hardware configurations without creating your own test harnesses, then consider the following:
- MongoDB Labs maintains a YCSB repo to test simple key-value operations.
- PY-TPCC, our adaption of the TPC-C benchmark for MongoDB, implemented in Python.
- Socialite is a reference architecture for modeling, querying, and aggregating social data feeds.
That’s a Wrap
Thanks for sticking with us over this journey into MongoDB performance best practices – hopefully you’ve picked up some useful information along the way. MongoDB University offers a no-cost, web-based training course on MongoDB performance. This is a great way to accelerate your learning on performance optimization.
Remember the easiest way to evaluate MongoDB is on Atlas, our fully managed and global cloud service available on AWS, Azure, and Google Cloud. Our documentation steps you through how to create a free MongoDB database cluster in the region and on the cloud provider of your choice.