I need to create charts that summarise the number of documents matching a ProjectNumber in either (and in both) collections so I can’t use a filter as that would force matching one or both.
Is there any way to define a custom filter/variable for “ProjectNumber” that I can use in the chart queries?
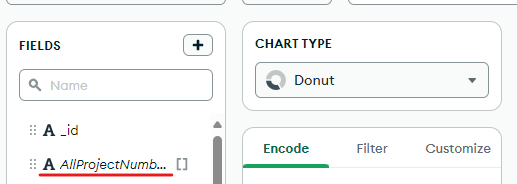
Yes, you can do this either by adding a calculated field, or by putting a custom pipeline into the query bar. In either case, the resulting value will be shown in the field panel and can be used for filtering.
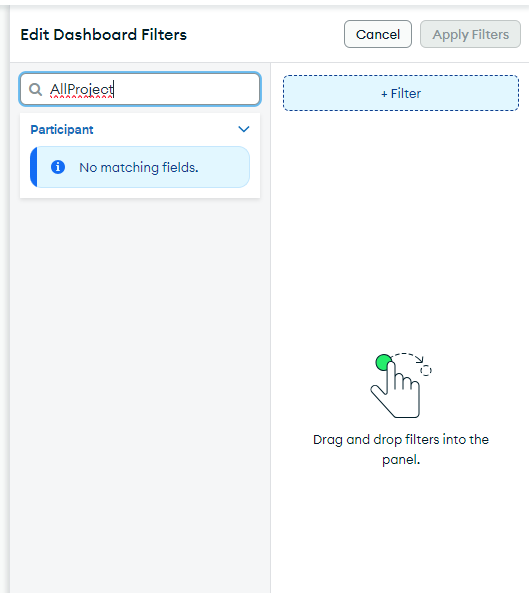
When I try to add a Dashboard filter- I might not have been clear it was a dashboard filter I want to add. My computed field itsn’t an option and I have no option to add “missing” fields.
Ah sorry I missed that you were trying to use dashboard filters. Dashboard filters do not allow you to use fields defined in individual charts. However you can create a Charts View on the Data Sources page containing your pipeline, and then you can use that in the dashboard filters.