Bug when geo heatmap is embebed in a page

hello mongo db team

I have a dashboard in mongo DB charts with only one chart, this chart is a geo heatmap.

I created my heatmap and worked excellently…

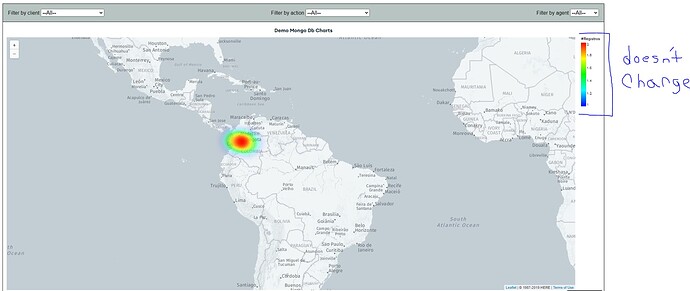
if you can see in the right corner there is a bar that indicates the deep in the graphic, this bar works excellent on your web page, if I make zoom in or zoom out the bar changes the scale properly, but when I embed this chart in a web page using iframe or node js SDK, and I make zoom in or zoom out the indicator bar doesn’t change the scale, permanently is fixed.

chart embedded using node js sdk

can you help me?
this is my sdk implementation
charts-embedding-sdk (forked) - CodeSandbox

The feature I particularly appreciate is the bar in the right corner that indicates the depth in the graphic. When I zoom in or zoom out on the web page, the bar scales properly and adjusts accordingly.

However, I encountered an issue when embedding this chart in a web page using the iframe or Node.js SDK. When I zoom in or zoom out on the embedded chart, the indicator bar does not change its scale. It remains fixed and does not update dynamically like it does on your web page.