Our server has been encountering overloads that coincide with high cache update rates that more than doubled when we upgraded to from Mongo 4.4 to Mongo 5. We have noted similar large increases in Checkpoint sizes and we suspect our overloads are caused by stalls in the Checkpoint writing process.
Tracing back through our logs we found that immediately after upgrading we started writing roughly 50% more data in each checkpoint, and our cache activity is more than double what it used to be:
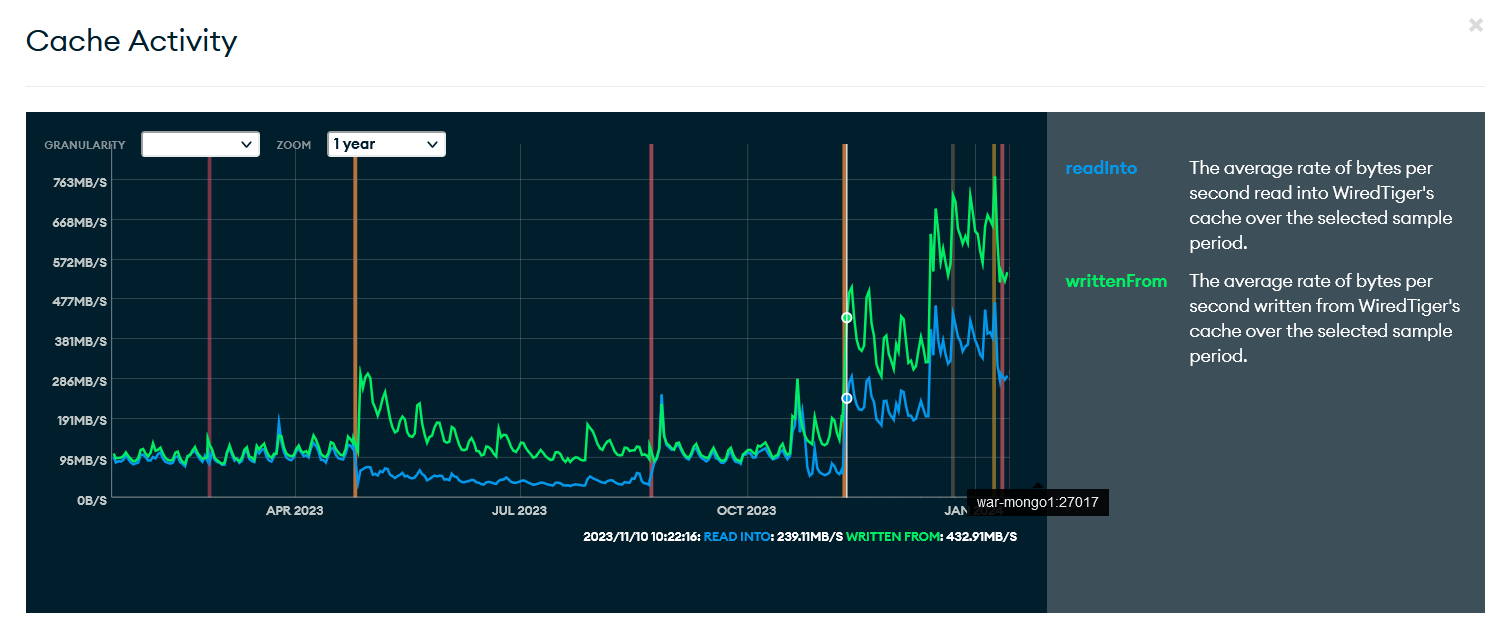
The point marked in November is where we upgraded to Mongo 5; as you can see we went from writing maybe 150MB/s on average to well over 300MB/sec.
I should add that this first surge in cache activity was not coincident with a surge in user activity; that came a few weeks later and was the second step upwards to staggering levels 6 or 7x what we have historically seen.
Picking random samples from logs we found evidence that checkpoints are now writing 50% more data and taking 50% longer as well (despite comparable page counts!)
2023-11-01T00:07:12 Checkpoint ran for 22 seconds and wrote: 20855 pages (8552 MB)"}}
2023-11-01T00:08:35 Checkpoint ran for 22 seconds and wrote: 21215 pages (8919 MB)"}}
2023-11-01T00:23:30 Checkpoint ran for 22 seconds and wrote: 20633 pages (8270 MB)"}}
2023-11-15T00:21:32 Checkpoint ran for 36 seconds and wrote: 21570 pages (12428 MB)"}}
2023-11-15T00:23:11 Checkpoint ran for 39 seconds and wrote: 22813 pages (13429 MB)"}}
2023-11-15T00:24:51 Checkpoint ran for 38 seconds and wrote: 24130 pages (14067 MB)"}}
In desperation we recently doubled the amount of RAM in our server cluster; this made no difference to our overloads although did clear a few waits from profile captures.
We changed the default write concern to “1” for most operations (to match 4.4) and this didn’t see to help either.
We tried adding --wiredTigerEngineConfigString “eviction=(threads_min=20,threads_max=20)” to our startup args and it seemed to make things much worse (we have a 24 core/48 thread server that typically runs 10-13 threads busy)
Although we’ve been overloaded in normal operations we have a script we have used for years that historically could span 16 or 24 threads without trouble that now will overload the server even when used with only 8 threads.
Although it may be treating the symptoms (50% larger Checkpoints) and perhaps not the root cause (2x as many dirty pages) we are considering trying to disable Snappy compression because we noted that the average Checkpoint writes speed is often around 300MB/s which isn’t much higher than the suggested Snappy compression speed of 250MB/s.
We are also considering reverting to 4.4 to test the theory that this is a regression in Mongo 5. We are not in a position to upgrade to 6 just yet because we still depend on scripts using the legacy shell. We have also scoured the release notes for Mongo 6 (and 7) and could find no mention of improvements to checkpoint writing so we are reluctant to rush forward to 6 at this time.
Currently running 5.0.23 on Linux 4.15.0-213-generic x86_64 Ubuntu 18.04.6 LTS
768GB of RAM, 6TB NVME SSD. Cluster has 3 identical visible members and 4 hidden members for disaster-recover, backups, and analytics.
Any advice welcome; we can open a Jira instead if you want private telemetry.