Hi,
We are using the Charts Embedding SDK to include charts in our customer dashboards. Customers have injected filters to only see their data, as well as, individual settings per chart to customize the layout and filter data further.
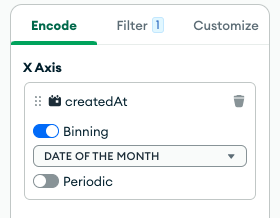
One thing that I can’t figure out how to do, if it is possible, is to dynamically change the “binning” of a chart with a time range on an axis. Say I have the “createdAt” field on the x-axis, with the binning set to “hour”, how can I (if possible) change it to “minute” through the SDK?

Our frontend is React using charts-embed-dom v3.2.0
Kind regards,
Zakarias