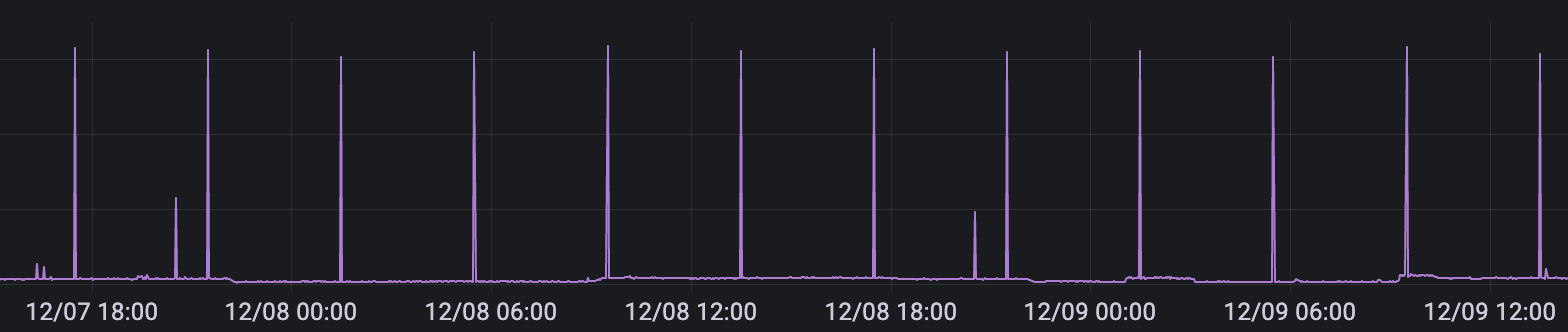
While I’m exploring options to use mongodb sharding, and we have using it in our test environments BUT what I’m unable to understand is, Config, router and one of the shards CPU spikes for every 4 hours from 1 to ~30% and I failed to understand the cause of these SPIKE, I turned of balancer and seen but no help, can someone help me to understand it properly regarding the spikes that occurs for every 4 hours,
Also it would be great if someone can explain how does balancer looks for number of chunks on a shard, I mean How it is scheduled to check? and can we alter this?
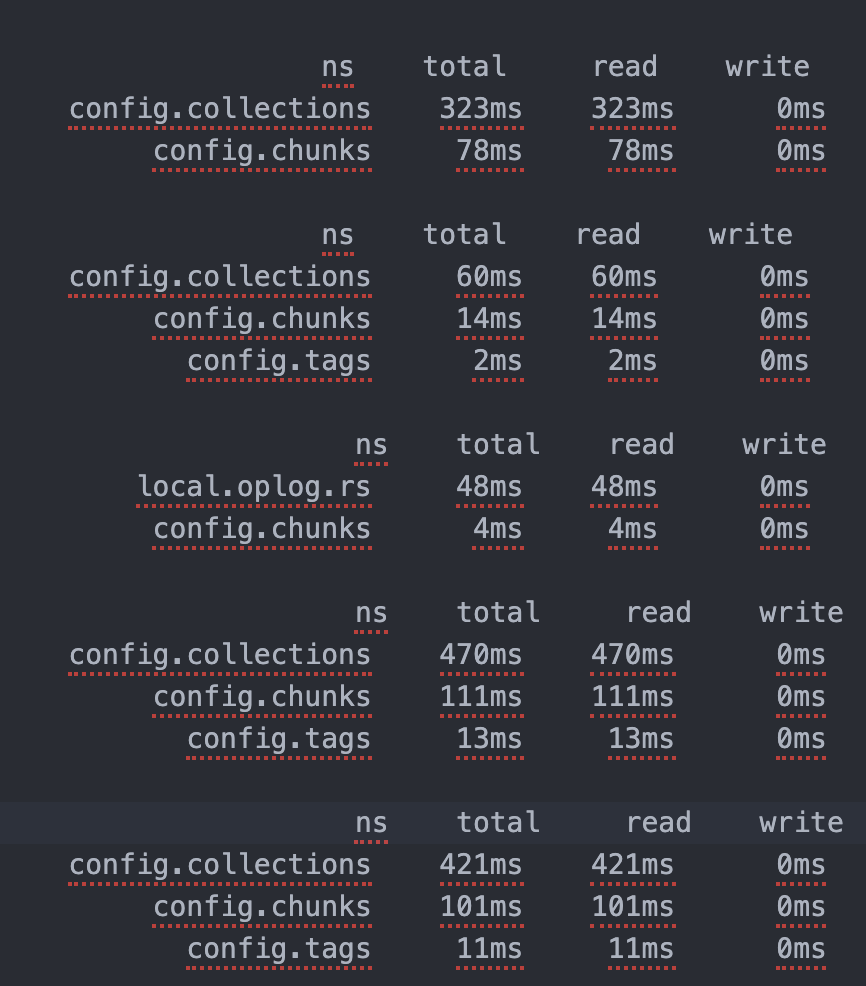
When this is happening, can you run mongostat and mongotop to see if you can identify the root cause ? Maybe a batch operation ?
Are these nodes collocated on the same physical machines by any chance and this could be completely independent from MongoDB ? Something in the CRON tab?
I wouldn’t mess with the balancer. Especially if you already identified that this isn’t the root cause of the problem. It’s already heavily optimized.
Thanks for the response, But I don’t have any JOB’s running in the background, All I can say is we have not changed any default settings of the mongo sharded cluster, We tried by enabling debug level also BUT no use,
Can you please help me in understanding the above one. Also, I’ve another Question, How do we choose the number of shards needed for prod environment, is it like based on expected data growth or on based on available data oR anything which I’m missing?
1 => Should be relatively small as you shouldn’t have a huge number of collections. How many docs do you have in this collection? Spending that much time in this collection don’t make much sense to me.
2 => Should contain a lot more. This makes a bit more sense.
3 => Tags should also be a very small collection. Few docs I guess? Can you confirm?
But given the fact that a lot of read operations seem to happen in these internal collection, my best bet is that you have a backup plan running every 4 hours?
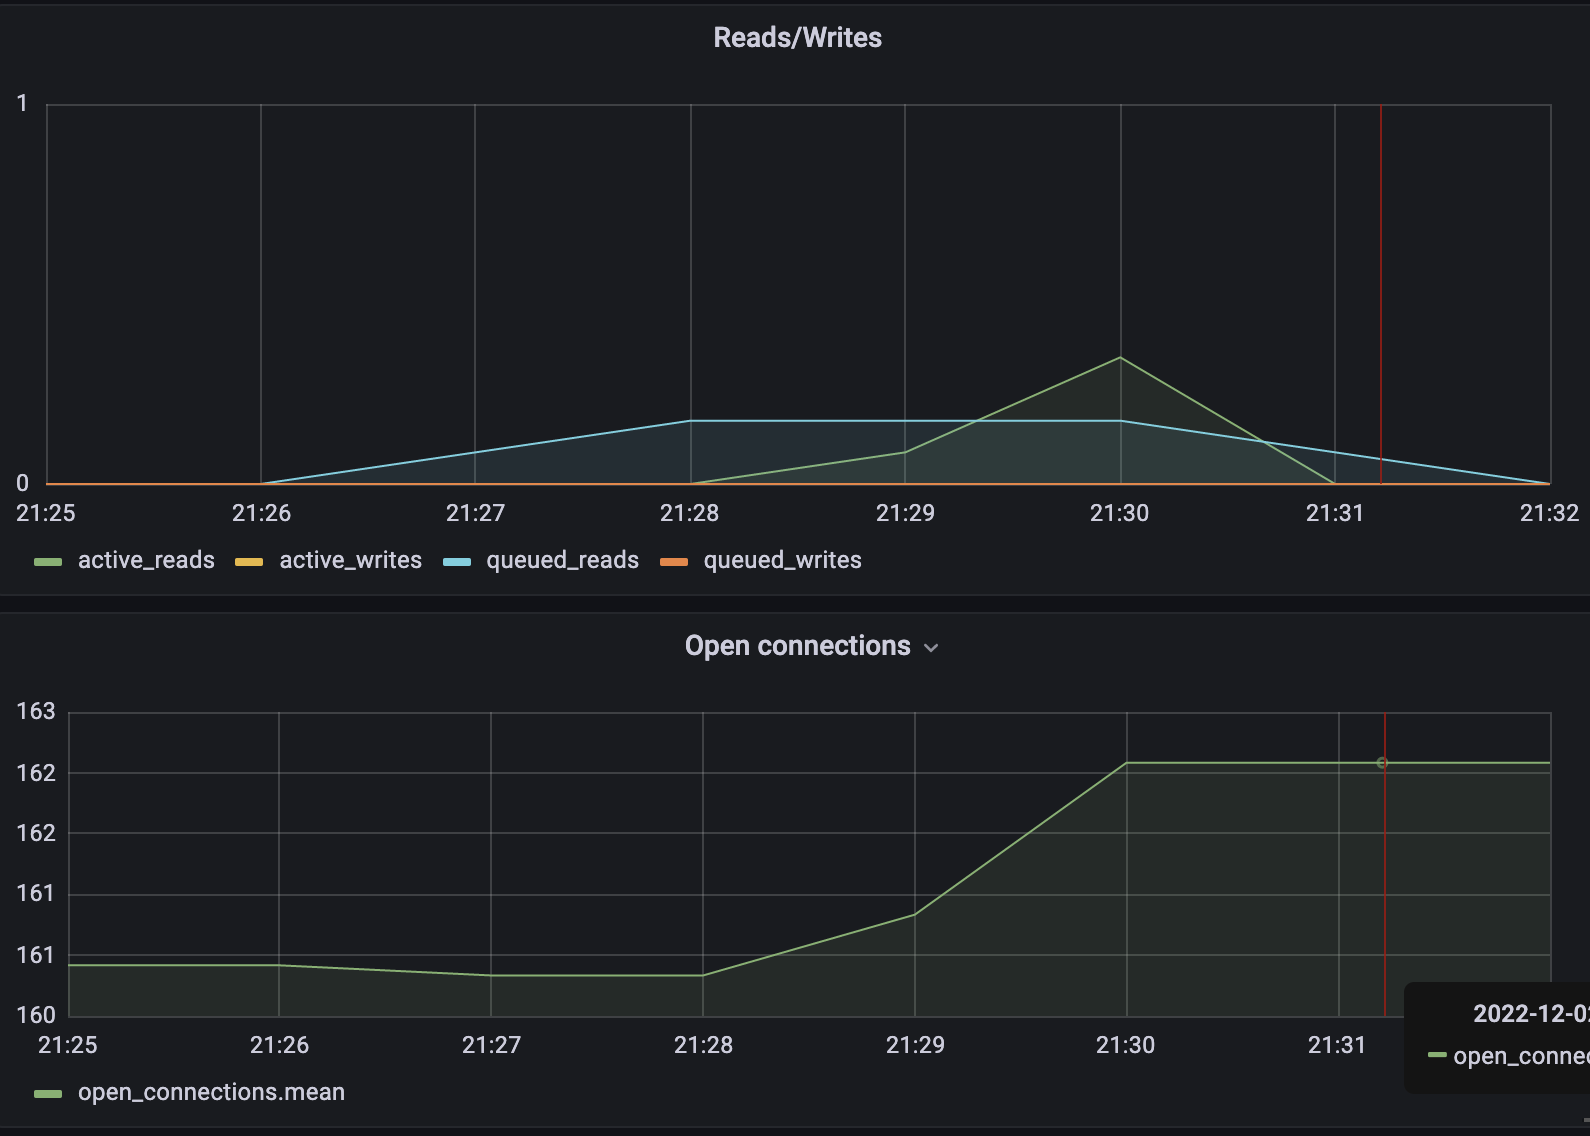
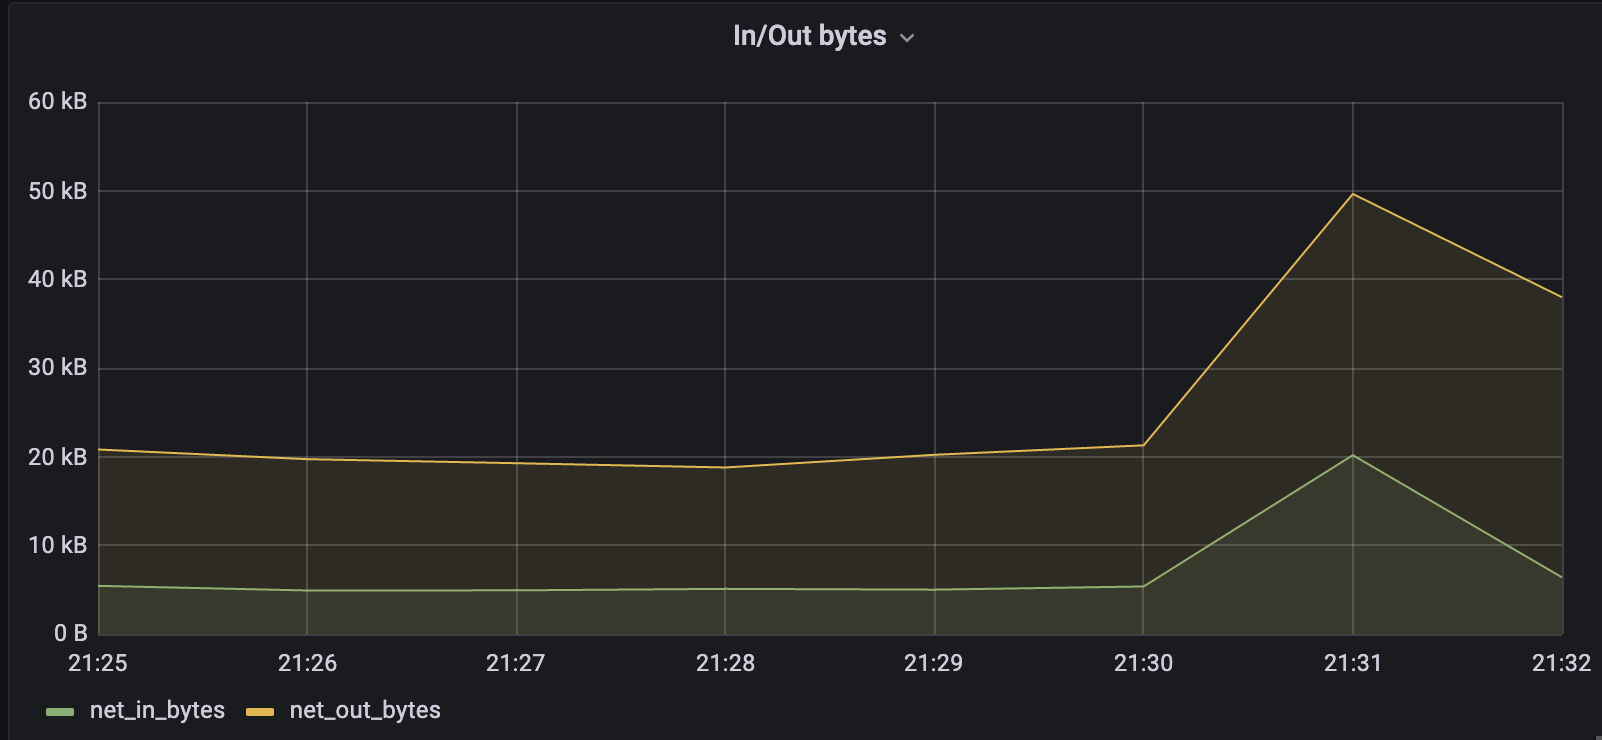
Do you also have anything else increasing at the same time? Like number of connections? What does mongostats looks like?
db.tags.countDocuments() gave me 0 and all these I’ve extracted from mongos(router) and db is config.
So far I remember, We have not altered any of the default configurations and no backup is also scheduled.
And Yes, I’ve see the growth in connections during the spike but the growth is <5 it seems.
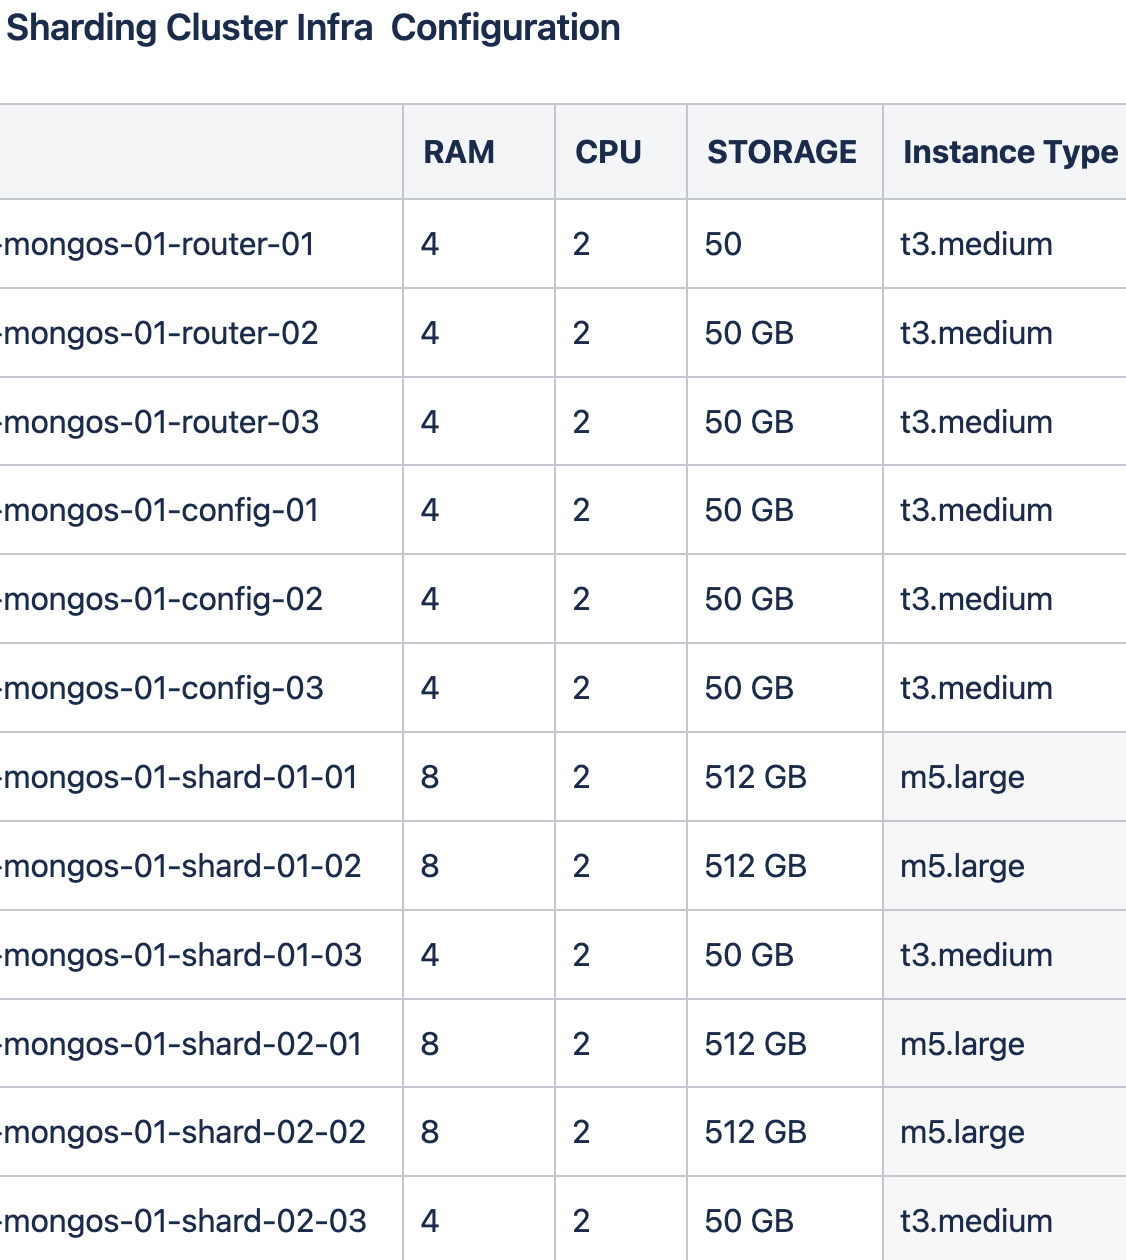
You are running shards with arbiters. I wouldn’t recommend using arbiters, I already explained this at length in several posts in this forum. To sum up: more chances to go down and you can’t write with a writeconcern more than w=1 in this situation.
Why are you sharded for “just” 300GB? Usually we recommend to shard when your cluster reaches 2TB. Not before as this would be more expensive to maintain 12 nodes VS 3 for a standard Replica Set with P-S-S.
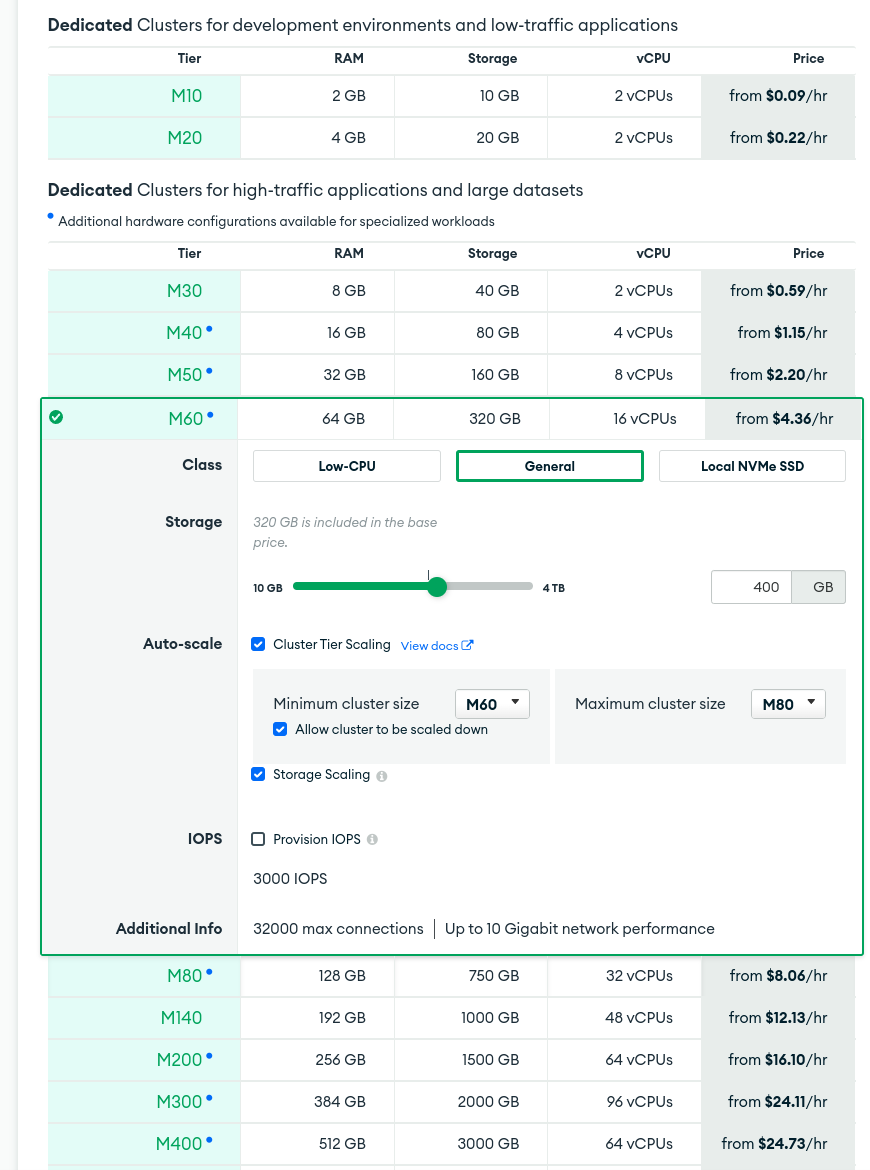
Usually MongoDB is healthy when you have about 15 to 20% of RAM compared to the amount of data. So in your case 300 * 15% = 45GB of RAM minimum and you only have 8+8=16. So I’m guessing that your cluster is starving for RAM. MongoDB nodes need RAM for the OS, the indexes, the working set and the aggregations / queries / in-memory sorts. If you don’t have enough RAM, it means that more cache evictions are happening and thus generate more IOPS from the disks that constantly need to retrieve the same docs which generate CPU workload in return as docs need to be decompressed, etc. So back to my previous point (2). If you don’t have another valid reason for sharding (throughput issue or data sovereignty issue (GDPR, …)) I would just stick to a single RS with 3 nodes (PSS) but with a LOT more RAM. See the recommended amounts based on MongoDB Atlas Tiers.
It would be nice to upgrade to MDB 6.0.X but 5.0 isn’t that old so this shouldn’t be a big issue here.
So if the CPU spikes aren’t causing big problems, I’d rather focus on the other issues I pointed out that are more pressing in my opinion. Maybe this will resolve the CPU spike issue as well as this could be related to the lack of RAM.
This is just test environment, in production we have more than 5times(2TB), just trying to understand the concerns for around these periodic CPU spikes to explain ourself!.
Lets me see it by increasing the RAM whether these spikes comedown or not.
Concern is without any load the CPU is having spike.
Yes you are right.
Goal is to reach min 1TB and we are daily loading some data into the sharded cluster and then run few perf tests to analyse them thoroughly!
So, here we are still in learning phase, Here I would like to add few more points which i should have told you earlier.
3.1 with current data(~300 GB) memory utilisation is around 50% on Avg.
3.2 Percent Used Cache and Dirty Cache seems to be very normal, so I don’t think this is the problem with having less RAM.(attaching screenshot for reference)
3.3 the CPU spike is observed even there’s no activity in the cluster and it’s happening every 4hours constantly. we want to nail down what is causing it at thread level.
Also Can you please help us in profiling the mem usage and cpu usage?
Your Help Is Much Appreciated
If all else failed, have you tried rebuilding everything from scratch, and observe the same spikes in the new builds? This way perhaps we can rule out any hardware anomalies from the AWS end.
This has been identified, Our infra has created the cluster using Ansible.
RC:There is a scheduled process which runs for every 4 hours to look after the configurations against Ansible script, when we have turned off this scheduled process there was no spike and when we manually triggered the .sh file, we got to see the spike, So this is not the problem of mongo.