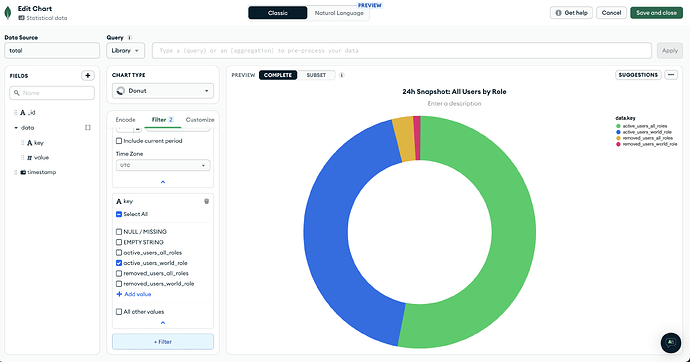
The problem is that the filter is selecting one of the values of the field “key” that is inside the array “data”, but the report is showing all of the values of “key” and not just the selected one.
Hi @Alberto_Nieto -
This behaviour is occurring because the filter is being applied before the array is unwound. Basically it’s filtering for documents where the array contains the expected values (in addition to other values) and then it’s unwinding all values to show on the chart.
To get the behaviour you want you need to move the array unwind before the filter. To do this you need to use the query bar, e.g. by specifying:
[{$unwind: "$data"}]
And then the filter will apply to the unwound values, filtering out anything you don’t want.
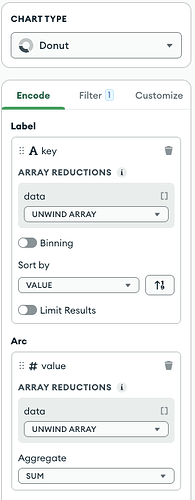
I don’t think that should be the case as if I check the “Encode” tab, I can see that the “Array reduction” option selected is already “Unwind”. Am I missing something here?
You are indeed unwinding the array, but when you do it this way it happens after the filter stage. You can’t change this so you need to move to unwind to the query bar to support your scenario.

