Hello,
I have a time-series use case question…
I have a Reviews collection which contains 370k records. the reviews collection contains data such as:
companyid: 'company-a',
reviewedDate: new Date(...),
comment: 'etc',
score: 3
To demonstrate my issue, I have a simple aggregation that calculates an average of all Review rows.
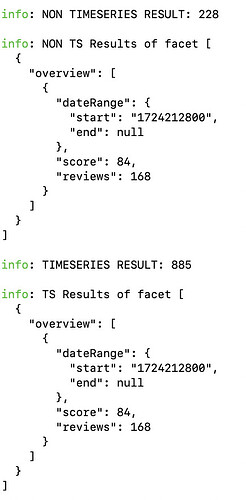
#1 - Have 1 big time-series collection for all companies (370k records), and use timeField: reviewedDate and metaField: companyid. When I query this collection, the average is around 885ms.
#2 - Have a separate, regular collection for each company. When i query this collection with the same aggregation, the average is around 230ms.
Why am I confused: Given that I am providing a metaField as companyid, I am expecting the time series collection to perform with the same performance as the individual company collections.
This is my aggregation query:
[
  {
    "$match": {
      "companyid": "c8388ea5-a33b-4c54-b19d-557c062aa31e",
      "reviewedDate": {
        "$gt": "2024-08-21T04:00:00.000Z"
      },
      "status": "Reviewed",
      "enabled": true
    }
  },
  {
    "$group": {
      "_id": null,
      "averageScore": {
        "$avg": "$score"
      },
      "count": {
        "$sum": 1
      },
      "reviewId": {
        "$addToSet": "$id"
      }
    }
  },
  {
    "$project": {
      "_id": 0,
      "dateRange": {
        "start": "1724212800"
      },
      "score": {
        "$round": [
          {
            "$multiply": [
              "$averageScore",
              10
            ]
          }
        ]
      },
      "reviews": "$count"
    }
  }
]
Here are the results:
Okay, this is the end of the first question.
The second part… I tried to compare the performance of a single regular collection vs a single time-series collection:
Single regular collection with the same aggregation query came in at an average of 885ms.
Time-series collection with the same aggregation query came in at an average of 780ms.
The performance difference between the two is dissappointing and I am wondering if I am doing something wrong?
Given these results, I am inclined to believe that it is better to separate collections per company, which makes it much more difficult to update and work with - I really thought that metaField would index these companies’ data in the background.
What have I done to see if I am doing something wrong:
- When I bulk insert the data into the time-series collection, I sort in ascending order
- The # of elements that are actually used come to 168 (out of 370k records), so 880ms seems high
- I am using the latest Mongo version (8 on the Mongo Cloud, and dependency 6.0 on my NodeJS application)
This is my time-series single collection configuration:
What do you recommend I try differently?
Thank you very much,
Mihai

