We are on the “Cloud Manager Standard” plan, and want to visualize our slow queries so we can optimize the performance.
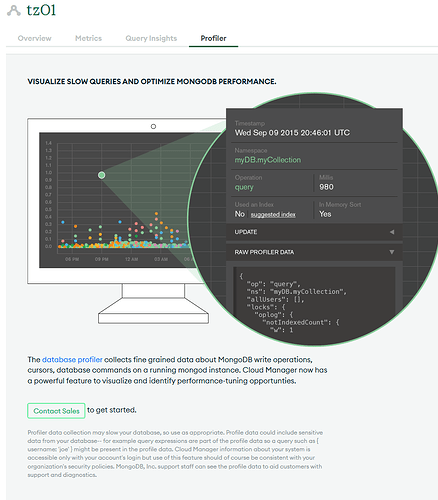
On the Cloud Manager under the Profiler tab, we don’t have any graphs but there is a “contact sales” button to get started.
We reached out to sales a few weeks ago but still no respons.
So instead I reached out to the support chat, to get help and was informed that the profiler is already included in our plan and we only need to active it.
We followed the steps to activate the profiler (lvl 2) for our nodes, but still get no graphs. (Still says contact sales to get started).
So Sales is not responding, support says it’s included, we followed their instructions, and it still isn’t working, now support refuse to help us further and want us to pay for consulting which in turn is managed by sales that isn’t responding. It’s not that we are not willing to pay if it costs, its just they are refusing to sell and even so according to support we are already paying for the service.
Can someone please help us enable the visualizer please.
