A brief history of GUIs
The digital world has evolved from a text-based command line interface to more convenient and intuitive graphical user interfaces through years of hard work and innovation.
The most important work toward developing a graphical user interface was started by Douglas Engelbart. Douglas believed that computers could be an interactive tool to solve more complex problems and not just a tool for automation. He thought that the keyboard was not sufficient to operate a computer. In 1964, he, along with Bill English, developed the first working computer mouse. He also developed NLS (oN-Line System), which he demonstrated in 1968 at the fall Joint Computer Conference held in San Francisco. He explained the computer mouse to be an “X-Y” position indicator for the display system. The NLS had a mouse-driven cursor, and the computer screen was divided into multiple windows displaying text.
The late 1970s saw the advent of database GUIs, the first one being Oracle’s GUI. As computers became cost-effective, computerization of databases became a natural choice. In 1973, Xerox Alto, the first graphical user interface in a true sense, had a design based on the WIMP (Window, Icon, Menu, Pointer) paradigm. Alto offered widgets like buttons, sliders, and text boxes that formed most parts of the desktop — rather a desktop metaphor!
In 1979, Steve Jobs (the then founder of Apple) visited the Xerox PARC (Palo Alto Research Center) for a demonstration of the Xerox technology. Xerox wanted to partner with Apple to continue the work on GUIs.
In the same year, Oracle released its first database application, with visual elements, to interact with its relational database.
In 1981, Xerox Alto was modified to create the Xerox Star. The Xerox Star became the first commercial personal computer with a window-based GUI and a bitmapped display. It introduced the folder structure to store files — all of which could sit on the “desktop.” This was a new level of abstraction for the users. The computer had icons, folders, buttons, emails, and many features of modern computers.
In 1983, VisiCorp designed a GUI named VisiOn, which ran on MS-DOS. A striking feature of VisiOn was the hourglass cursor to indicate wait/busy time. Although VisiOn did not gain much popularity, it paved the way for the most successful graphical user interface, Windows, developed later by Microsoft.
In 1985, Microsoft announced Windows 1.0, which was going to make history in the world of personal computing GUIs. Windows 1.0 ran on MS-DOS and introduced the use of the mouse, multi-tasking, and built-in applications like Paint, a calculator, and Notepad. Windows were tiled rather than being overlapped. Microsoft also released Microsoft Access, a GUI-based database tool.
In 1986, Apple brought in Apple II, which could display color graphics. The same was demonstrated through the color spectrum logo of the Apple icon. 1987 saw Windows 2.0 with features like 16-color VGA graphics, desktop icons, keyboard shortcuts, Microsoft Word, and Microsoft Excel. Users could also resize and overlap windows.
Meanwhile, businesses started moving from relational databases toward non-relational databases. In 1998, Carlo Strozzi coined the term “NoSQL.” NoSQL databases quickly became popular due to their flexibility in storing data and the growing need for data persistence.
From here on, every new year saw a new version of a GUI operating system, each better than the previous.
MongoDB Compass, MongoDB’s first UI, was released in 2010. A striking feature of Compass was that it had the Mongo Shell embedded to directly control the deployments. Compass could show indexes, assess performance, analyze schema, and import/export data, without the need to write queries.
Post 2011, with mobile devices becoming more common, mobile GUIs became popular, with iOS and Android taking the lead in the mobile market. The air shifted quite fast from desktops to touchpads, touch screens, tablets, smartphones, and laptops.
With the growing popularity of cloud platforms, creating applications that could be accessed from anywhere, anytime (including databases) became inevitable. Microsoft brought its suite of applications, like Word and Excel, to the cloud, and so did Google.
In 2016, MongoDB came up with the MongoDB Atlas GUI, a cloud data platform, which would transform the way users perceive the capabilities of a database.
As of today, we also have the notebook interfaces, which combine text, graphs, and calculations and are widely used for scientific research and data science projects.
Advantages of graphical user interfaces
Graphical user interfaces provide a user-centered design, are easy to use and attractive, and allow for multitasking. A GUI can be used by programmers, business analysts, testers, and anyone who wants to operate a computer! GUIs give more control to the user to perform certain tasks and actions. Further, configuration and setting changes are quite easy in a visual format using features like toggle buttons or check-boxes for selection. UIs also remove the longer learning curve and dependency of users on the administrators to perform basic troubleshooting tasks and resolve operational issues.
How does a graphical user interface work?
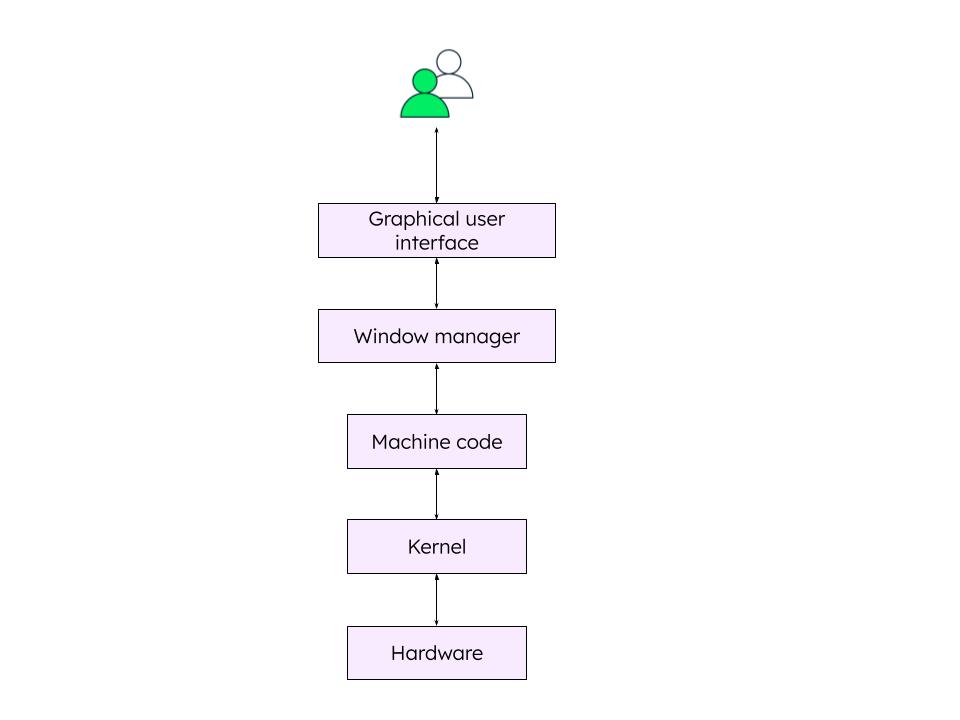
The basic design principles of a GUI are user satisfaction, simplicity, intuitiveness, reducing the cognitive burden on the user, and consistency. The aim of a GUI is to abstract the complex layers and actual working of a computer from an end user.
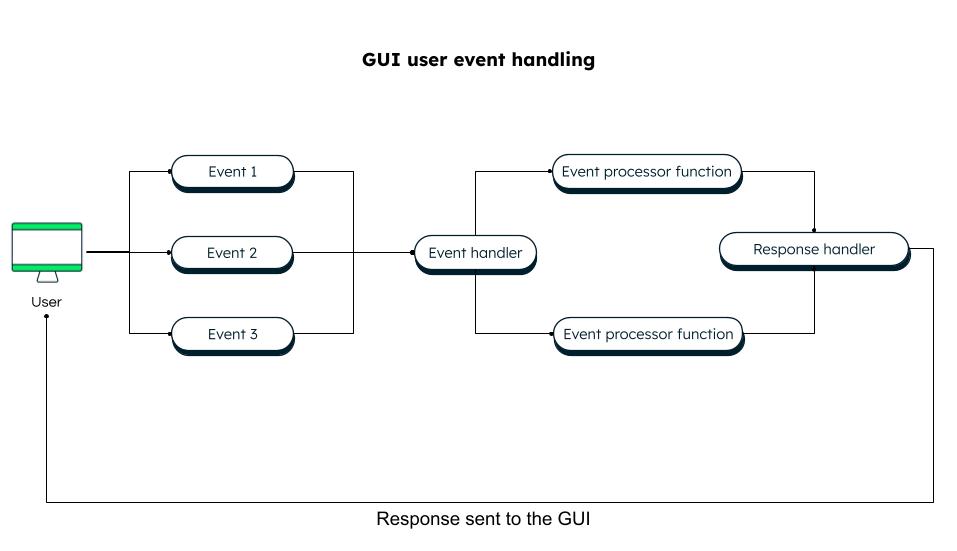
Under the hood, a GUI works on a set of commands based on an action by the user. Any action by a user is termed as an event. For example, if a user presses a key, an event “key down” is sent to the operating system for processing. Similarly, if a user clicks on a file, an event is sent to select and highlight the file. Events occur every time a user does something with a keyboard, touchscreen, or mouse. This event-based architecture is the basis for the working of a GUI system.
GUIs in MongoDB
MongoDB is not just a NoSQL database but an entire suite of products that help you manage, transform, and analyze your data. You need not worry about data security, indexing, clustering, load balancing, or scaling while using MongoDB. All of that is built into the platform through simple configurations. MongoDB provides the mongo shell as well as a GUI for the convenience of its users.
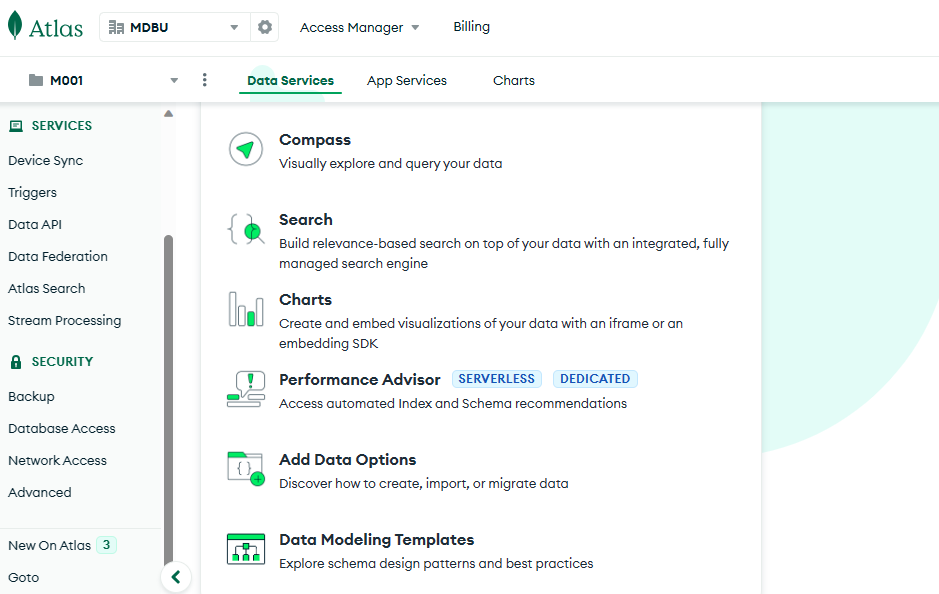
MongoDB Atlas
MongoDB Atlas is MongoDB’s cloud data platform, which handles all your data needs and is accessible anytime, anywhere. You can create a new account or use your Google or GitHub ID to log in and create your first cluster for free. The entire setup of choosing and creating a cluster takes less than five minutes using the Atlas UI. You can create an organization or projects, browse your collections, perform CRUD operations, create aggregation pipelines on your data, add and drop indexes, create beautiful visualizations, perform relevance-based full-text search, and much more — all in one place!
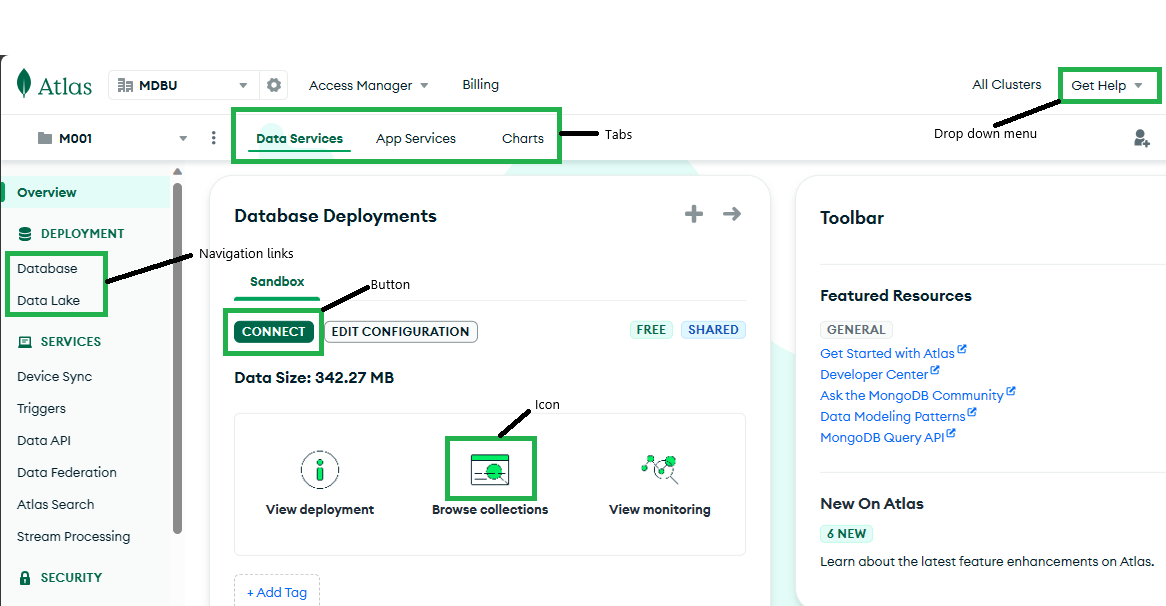
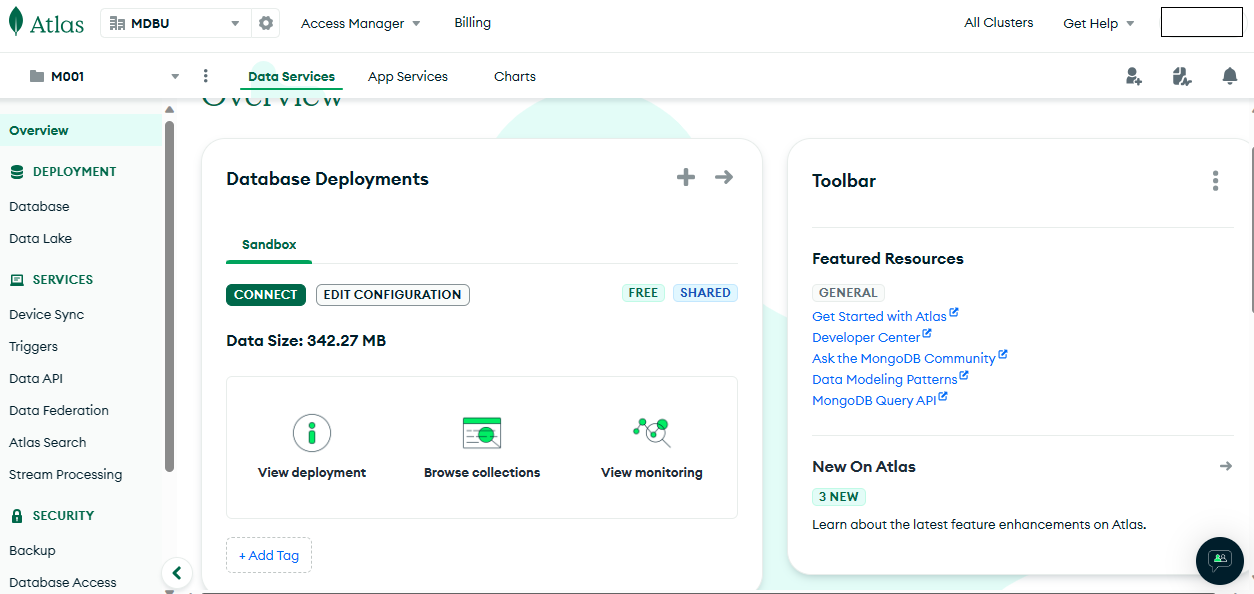
A sample of the Atlas home page is shown below:
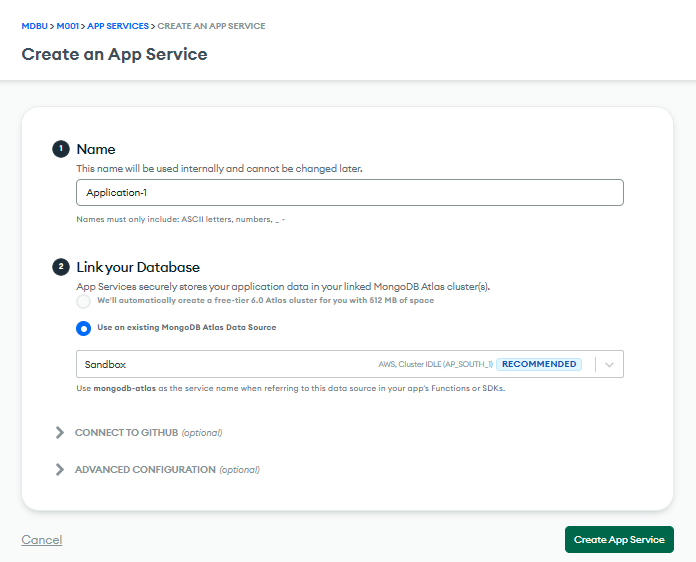
You can also create fully managed backend services (Atlas Application Services) through the Atlas UI. These include custom functions and triggers, syncing data across devices using REST API, or GraphQL to access data, and much more.
Atlas is a fully managed, modern, multi-cloud database to manage and secure your data.
MongoDB Compass
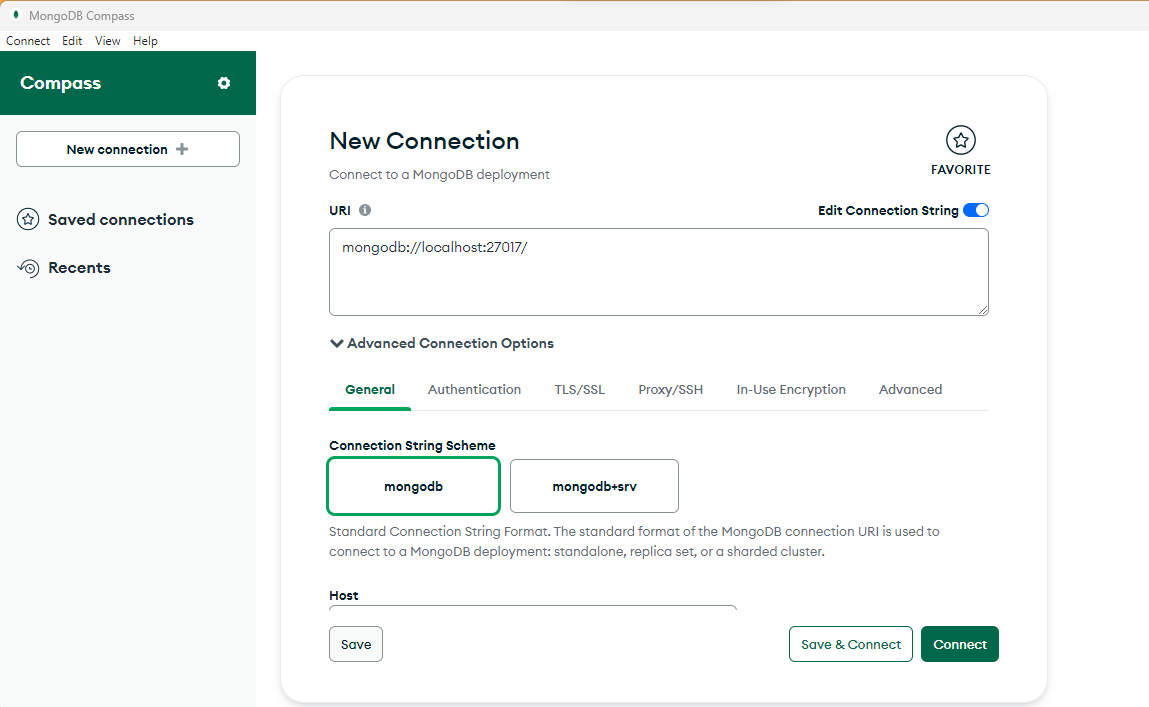
MongoDB Compass is an intuitive and flexible GUI for MongoDB. It provides features like detailed schema visualizations, real-time performance metrics, and sophisticated querying abilities. Unlike the Atlas UI, which is accessible over the browser, MongoDB Compass requires installation. You can download it from the MongoDB downloads page. Once you run the downloaded file, Compass will be installed within a few seconds. Then, you just need to connect to the database using the URL and any other additional options, like authentication.
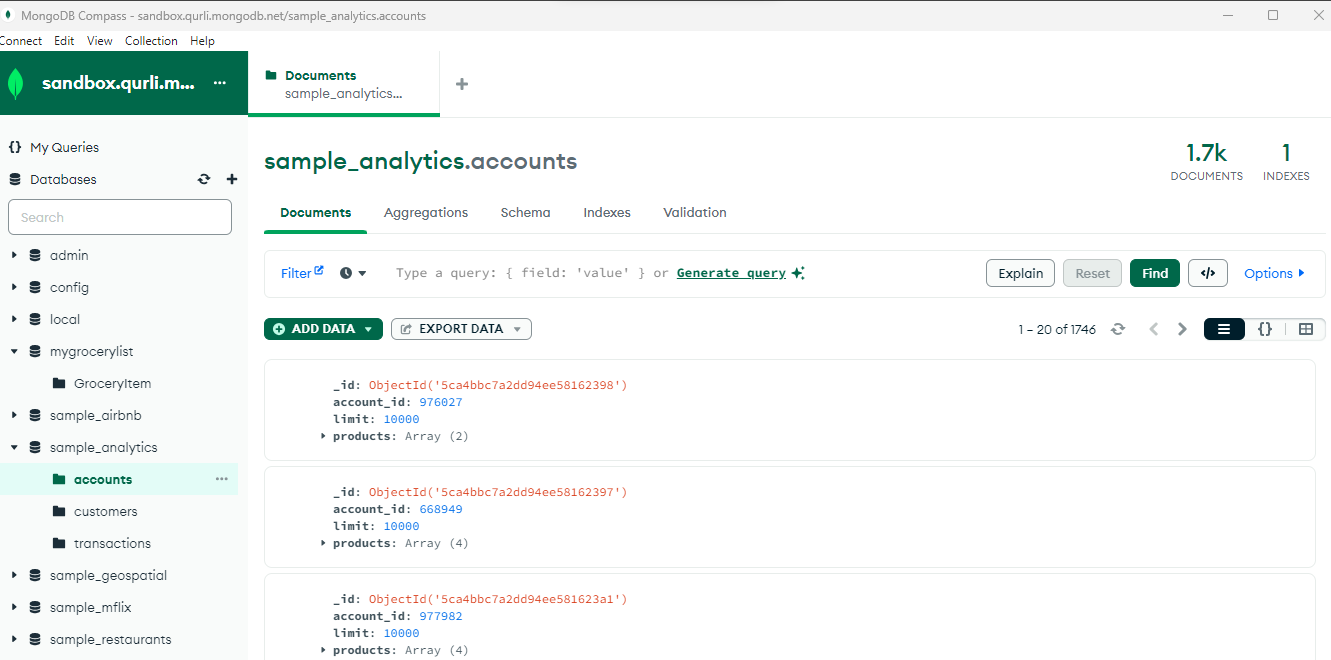
Once you are connected, you can see the database details on your Compass screen. You can also connect to your Atlas cluster using the URL. For example:
mongodb+srv://m001-student:password@sandbox.qurli.mongodb.net/
An interesting feature of Compass is “Generate Query,” where you can use natural language to query your collections. MongoDB’s AI-powered query generator creates the query and gets the results.
Read more about the capabilities of MongoDB Compass.