Observability is the practice of making a system’s internal behavior legible from the outside—capturing enough signal that an engineer can reconstruct what happened and why. For a web service, that signal is the request: a status code, a latency number, a stack trace when something throws. For an agent, the unit of behavior is a decision: the choice it makes between one call and the next. The agent reads context, chooses an action, calls a tool or a model, observes the result, and chooses again.
Agent observability is the practice of capturing that sequence of decisions and making it legible. This is Part 6 of a series on designing an agentic platform, and it covers what that requires: what to instrument, which metrics actually matter, and why the operations layer around agents is still being built rather than adopted.
Why monitoring, observability, and evaluation are three different jobs
Three jobs often get collapsed into one. Monitoring tracks whether the system is healthy. Observability reconstructs what the agent did and why. Evaluation judges whether what it did was any good. MongoDB’s developer blog has already covered the first for databases, in a three-part series[1] on query performance, latency, and resource utilization across a cluster; this post is about the second, and Part 7 of this series will take up the third.
Agent observability is a different problem from database monitoring. A database is a deterministic system where failure is explicit: a query is slow, a connection pool is exhausted, an index is missing. An agent is a non-deterministic system where every individual step can succeed, and the run as a whole can still fail.
An agent rewrites a function, runs the test suite, sees a failure, attempts a fix, and loops. Each iteration is a valid model call that returns within normal latency. Traditional application monitoring reports every span as successful, while the agent burns tokens in a loop that never converges—the failure class that Augment Code’s agent-observability guide[2] uses to justify fine-grained tracing, where a plan-and-execute agent retrieves the right answer and the replanner rejects it and re-plans, indefinitely. The same shape appears in other forms: a tool invoked with a parameter the model hallucinated, a retrieval that returned plausible but irrelevant context, a multi-agent handoff that dropped half its state. In each case the request-level log records that the run happened and how long it took. It does not record why the agent chose the path it did.
The reasonable assumption is that an existing MLOps or APM stack will extend to agents. It captures most of what a deterministic system needs, and it rests on an abstraction that has held for years: a model maps inputs to outputs, and observability means watching that mapping. The abstraction holds when the model is the system. It breaks when the system is an agent, because the behavior that needs explaining lives in the decisions between calls, not in any single call’s inputs and outputs. The rest of this post is about what the agent case needs that the request case does not.
This series is about engineering the agent harness and its runtime, and it treats several of the harness’s layers as places a failure can originate: state and persistence in Part 2, orchestration, and memory.
Agents do not fail at the observability layer. They fail in memory, orchestration, state, or tool use, and the root cause is genuinely distributed across those layers rather than concentrated in one. Production breakage becomes visible somewhere in the harness, rarely in the model call itself. Observability is the layer that attributes a failure to the correct components.
What agent observability captures: traces, reasoning paths, tools, and memory
The primary artifact in agent observability is the trace. A trace represents the full lifecycle of an agent task as a parent-child tree of spans: the top-level agent invocation, each model call beneath it, each tool execution, each memory read or write. Where a software engineer reads source code to understand a program’s behavior, an agent engineer reads the trace[2] to understand a run’s behavior. The source code is fixed; what the agent actually did emerges at runtime, and the trace is the only place it is recorded.
The instrumentation standard for these traces is converging on OpenTelemetry. The OpenTelemetry GenAI semantic conventions[3] define the span types an agent system emits—create_agent, invoke_agent, execute_tool, and invoke_workflow for systems that group several agent invocations—alongside the LLM client spans that carry model name, token usage, and latency. As of mid-2026, these conventions are still in Development status and have changed in nearly every release; version 1.37 reworked how multi-turn chat history is recorded[4].
Datadog added native support at v1.37[5], Honeycomb, New Relic, and Grafana consume the spans, and frameworks including LangChain, CrewAI, and AutoGen emit them. Vendor and framework support is broad; team adoption is not. Enterprises remain split between the conventions and bespoke instrumentation. The practical argument for the conventions is integration: a framework that emits them drops into a platform like Datadog or Langfuse with far less work than one that does not.
A useful span carries more than a name and a duration. It carries additional attributes that let a team ask questions across many traces at once: which tool fails most often, which model call consumes the most tokens, and where latency accumulates. Without them, a team is left reading runs one at a time.
Capturing spans is the operational layer of observability: where time went, which calls failed, and how many tokens each step consumed. The agent case needs a second layer on top of it. A reasoning trace is the sequence of implicit steps an agent takes to reach a decision—the action it chose, the tool it selected, the context that was in its window when it chose. Researchers have begun calling this cognitive observability[6] —a label still settling, though the underlying distinction is not—to separate it from the operational telemetry that can tell you a step failed but not why the agent’s reasoning led there. An operational signal localizes a failure to a step. The reasoning trace is what explains it. A reasoning trace captured as telemetry is run-bounded execution context (state, as this series defines it), not cross-session memory. Observability records it; it does not turn it into memory.
In a multi-agent system, the trace has to span the full coordination chain, not just one agent’s output. When a supervisor delegates to a researcher and a writer, a failure can surface in the writer while the cause sits in what the researcher passed along. A trace scoped to a single agent shows the symptom; a trace that follows the handoffs shows where the chain broke.
Much of what looks like a reasoning failure originates upstream, in retrieval. When an agent chooses the wrong action, the cause is often that the memory read feeding that step returned the wrong fragment, stale context, or nothing usable. This series has argued that some orchestration failures are memory failures in disguise; the reverse holds too, and a retrieval problem can present as a reasoning problem or a tool problem. Telling them apart is exactly what the trace is for. Memory access has to show up in the trace next to the model and tool spans—the query, what came back, and how relevant it was—so a failure can be attributed to the retrieval that caused it rather than guessed at. Memory-access logging belongs in the trace, not in a separate system that a team has to correlate by hand.
Agents that act through a browser add a layer that text spans cannot capture: what the agent saw. For a web or computer-use agent, the screenshot and the session recording are the perception record. Cloudflare built this into Browser Run[7] after hearing repeatedly that when an automation failed, teams had no idea why. The perception record is also the artifact that automated evaluation handles the worst. Agents that render tables, diagrams, or full interfaces produce output whose correctness an LLM-as-judge cannot reliably assess from the trace alone.
Figure 1. The same agent run seen two ways.
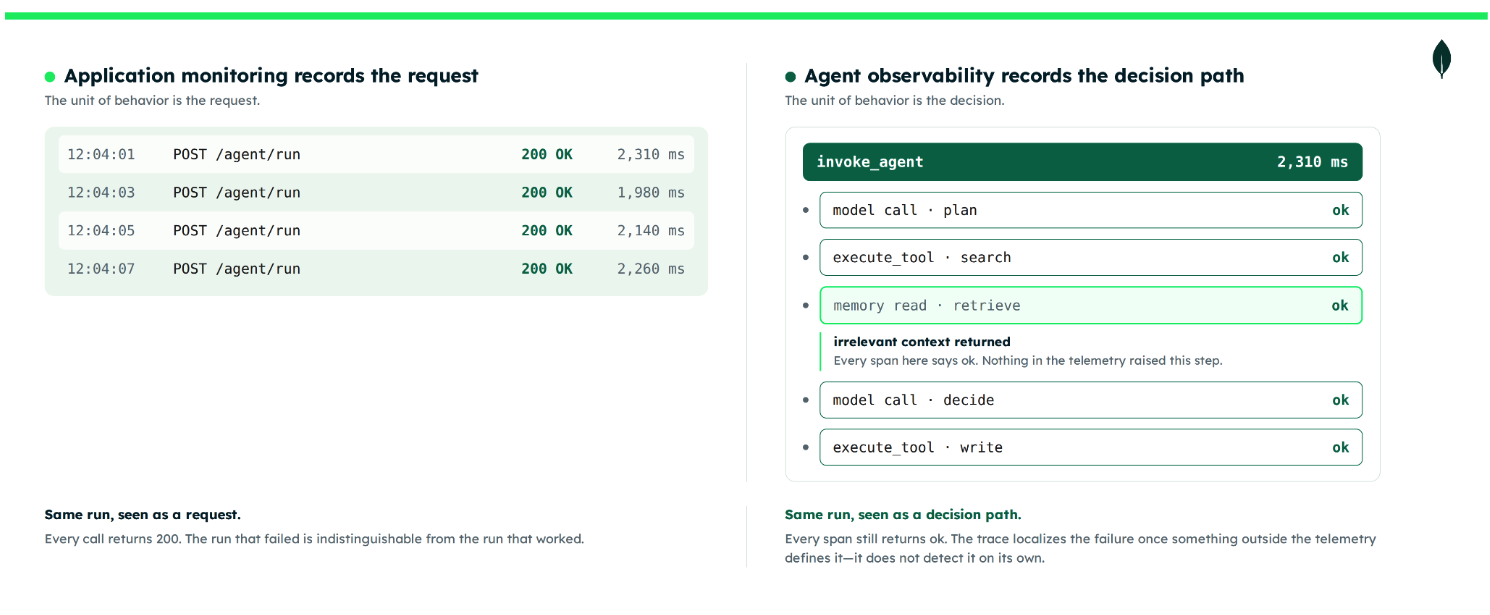
As a request, every call returns 200 OK, and the run that failed is indistinguishable from the run that worked. As a decision path, every span still returns ok—the trace localizes the failure to the memory-read step, but only once something outside the telemetry has defined it as a failure.
What to measure: Three metrics, three alerts, one audit trail
Why the operations layer is yours to build
One-half of agent observability is largely solved: capturing the decision path. LangChain’s LangSmith[8] instruments the decision-making layer directly, letting a team localize a failure to the step where a retrieval returned irrelevant documents or a model hallucinated a tool parameter, and attribute cost down to a single sub-task, sometimes finding that one sub-task consumes most of a trace’s tokens. Practitioners shipping coding agents have converged on operational patterns like tail-based sampling[2] (retaining every trace that contains an error, every trace that exceeds a cost threshold, and a small random sample of the rest) because full-fidelity capture is affordable in development and breaks storage budgets in production.
The gap teams hit is not capture but operations, and it begins with a definition problem. Teams adding agentic features to an existing application are used to the failure modes of conventional software: a crash, a stack trace, a non-zero exit code. Agents fail differently. Incorrect information given to a customer, a safety check bypassed. Neither announces itself in telemetry, and finding either one across a corpus of traces is closer to searching a haystack than to reading a stack trace. The consequence is that a trace can look healthy while the run is broken. A clean sequence of tool calls with no errors is fully compatible with a wrong outcome, because the agent retrieved the wrong context or took a plausible but incorrect path. Instrumentation is rarely where teams fall short; converting traces into something actionable is. The pattern across enterprise agent teams is that instrumentation arrives before the team has decided what counts as a failure, what to alert on, or what a security reviewer will need to see. The signal is captured; the operations practice around it is not yet written.
Trusting a trace enough to page someone off it takes more than a single instrumentation pass. It takes reliable instrumentation, a stable trace schema, agreed success metrics, and enough manual validation to confirm that the traces match reality. It also takes exercising the detector against positive and negative cases, so that it fires on the situations that are genuinely problems and stays quiet on the ones that are not. How many cycles that takes depends on how much the use case can tolerate being wrong.
A related problem shows up in how teams use the signal once they have it. Hamel Husain, who has consulted on more than thirty production AI implementations, describes teams building dashboards full of generic scores[9]—helpfulness, toxicity, correctness—and celebrating improvements that do not correlate with real outcomes. Capturing the trace is necessary; measuring the wrong thing on top of it still leaves the team blind.
The discipline has a name and no standard. AgentOps has been formally defined by IBM[10] and Microsoft[11], but as IBM acknowledges, there is no universally agreed-upon means of conducting it. The closest precedent, DORA[12], expanded its 2025 report to six metrics and seven team archetypes, yet every metric still measures how AI tools affect human developers rather than how agent systems themselves perform. There is, as of this writing, no DORA-for-agents.
Three metrics, three alerts, and the audit trail
That practice comes down to three things: what to measure, what to alert on, and what to prove to a reviewer. Each rests on the same precondition: a platform that makes the decision path observable by default. It emits OpenTelemetry-compliant spans, so a team’s traces stay portable across backends and the team is not locked into one vendor’s tracing tool. It treats memory reads and tool calls as first-class nodes in the trace, so a reasoning failure can be traced back to the retrieval that caused it. And it produces an audit trail from the first deployment rather than the tenth. An audit trail retrofitted under review pressure is a harder artifact to produce, and a less trusted one, than a trail that was emitted from the first run.
Three metrics matter from the start. Decision quality measures whether the action the agent chose advanced the task. Memory-retrieval relevance measures whether a retrieval returned context that the agent could actually use. Fully-loaded cost per task measures the cost of a completed task in total: infrastructure, tokens, and human oversight together. The third has no real precedent in DevOps dashboards—every autonomous action carries a direct, variable cost, and a stack that cannot see it cannot tell whether a change made tasks cheaper or just moved the cost somewhere else. It is also the metric teams most often skip. Decision quality tends to get discussed qualitatively rather than instrumented, because it is harder to operationalize than spend, and in production it is usually computed several ways at once: downstream outcome analysis to catch regressions, an LLM-as-judge pass to score semantics at volume, and human review for the cases where the judgment is contested. Where those three signals disagree is where the definition of “good” starts doing real work.
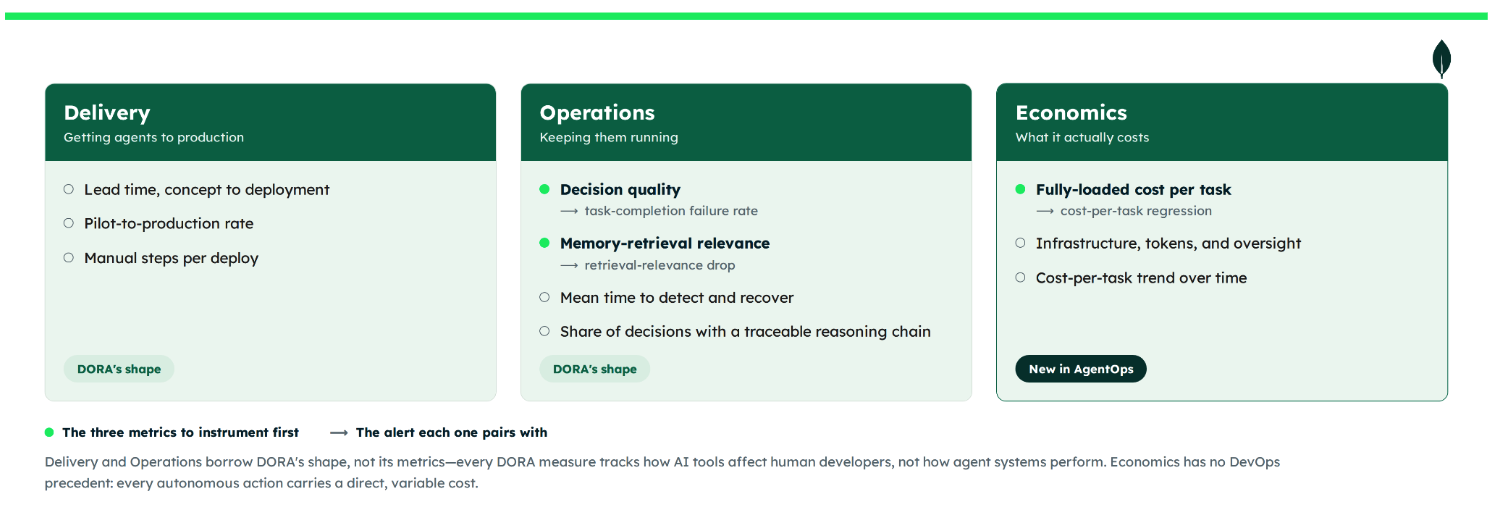
These three metrics sit inside a broader frame, the closest thing the discipline has to a map. AgentOps borrows two clusters from DORA and adds one it never needed (Figure 2). Delivery covers getting agents to production: lead time from concept to deployment, and the share of agents that make it out of pilot. Operations covers keeping them running: mean time to detect and recover from a failure, and the percentage of agent decisions with a traceable reasoning chain, which is a direct readout of whether the trace instrumentation is in place. Economics is the third cluster: the variable cost of autonomous action. Measuring all three at once is mostly a question of whether the tooling composes—fully-loaded cost per task in particular pulls infrastructure, token, and oversight numbers from systems that often do not talk to each other.
Figure 2. The three AgentOps metric clusters.
None of this requires a new platform to start. A team can instrument one agent end-to-end with the OpenTelemetry GenAI conventions, beginning with the model-call instrumentation that auto-captures token usage and adding agent-level and tool spans from there. Set tail-based sampling[2] so every error trace and every high-cost trace is retained. Then stand up three alerts. The first is task-completion failure rate: the share of runs that end without the user’s task being done. It comes before latency, cost, and quality alerts because it is the earliest signal that the agent is breaking in a way a user feels, and non-convergence, a run that exceeds its step or cost budget, is one of the ways it breaks. The second is a drop in retrieval relevance, which usually precedes a drop in decision quality. The third is cost-per-task regression.
The last check is the reviewer’s test. Pick an agent action from last week and try to reconstruct, from the trace alone, why the agent took it. If the reconstruction is possible, the audit trail is real. If it is not, that is the gap to close before a compliance team finds it. Most teams get partway. The trace will show which tools were called and what came back, which is enough to reconstruct the sequence of actions. What it does not yet produce is the account a reviewer is asking for: what the agent was trying to do, whether the action was within policy, and which alternatives it weighed and set aside. That account has to be assembled from the trace, and today it is mostly assembled by hand.
The audit trail carries a compliance cost of its own. A reasoning trace records whatever sat in the agent’s context window, which, for most applications, includes user data, and a telemetry pipeline that ships raw traces to a tracing backend ships that data with them. Redaction belongs in the pipeline rather than in the backend’s retention policy. Part 3 covers where that governance boundary sits; the requirement observability adds is that a trace has to survive redaction and remain reconstructable.
Next Steps
Ready to start building? Get started with MongoDB Atlas for free today.
Where observability ends, and evaluation begins
Instrumented well, a trace shows every step an agent took: the context it read, the action it chose, the tool it called, the cost it incurred. It does not show whether the decision was a good one. Judging the decision means defining what “good” looks like for an agent and testing against it, which is a separate problem from capturing the path. Part 7 takes it up, with a framework for evaluating agent memory and a public leaderboard that puts the definitions to the test.
This week, instrument one agent run end-to-end with the OpenTelemetry GenAI conventions and set the three alerts: task-completion failure rate, retrieval-relevance drop, and cost-per-task regression.
Frequently asked questions
What is the difference between agent observability and monitoring? Monitoring and observability answer different questions. Monitoring tracks whether a system is healthy—whether it is up and within its latency and error budgets. Observability reconstructs what the system did and why. For an agent, the behavior that needs explaining is a sequence of decisions rather than a single request, so agent observability captures the decision path: the context the agent read, the action it chose, the tool it called, and the memory it accessed. A run can pass every health check and still reach the wrong outcome, which is the gap monitoring alone cannot close.
How is agent observability different from evaluation? Observability shows what an agent did; evaluation judges whether what it did was any good. A trace can capture every step of a run completely and still say nothing about whether the decision was correct. Judging that means defining what “good” looks like and testing against it, a separate discipline. In this series, capturing the decision path is the subject of this post; evaluating agent memory against a defined standard comes next.
Can an existing APM or MLOps stack handle agent observability? Partly, but not where it matters most. An APM or MLOps stack captures what a deterministic system needs and rests on the assumption that a model maps inputs to outputs. That assumption holds when the model is the system, and breaks when the system is an agent, because the behavior that needs explaining lives in the decisions between calls, not in any single call’s inputs and outputs. Agents need decision-level observability: reasoning traces, tool calls, and memory reads recorded as one connected path, which request-level monitoring does not provide.
What should you measure for an agent in production? Three metrics matter from the start: decision quality (did the chosen action advance the task), memory-retrieval relevance (did a retrieval return context the agent could actually use), and fully-loaded cost per task (what a completed task cost in infrastructure, tokens, and human oversight together). The third has no real precedent in traditional dashboards, because every autonomous action carries a direct, variable cost. Pair the metrics with three alerts: task-completion failure rate, a drop in retrieval relevance, and cost-per-task regression.
What is AgentOps? AgentOps is the emerging practice of operating agents in production with the same rigor applied to other production infrastructure. It borrows two clusters from DORA—Delivery and Operations—and adds a third that software delivery never needed: Economics, the variable cost of autonomous action. The term has been defined by several vendors, but as of this writing there is no universally agreed standard for how to conduct it, so teams adopt the instrumentation and build the operations practice themselves.
Is a reasoning trace the same as agent memory? No. A reasoning trace captured as telemetry is run-bounded execution context: state, in the sense this series uses the term. It is not cross-session memory. Observability records the trace; it does not promote it into memory. Memory is durable, cross-session knowledge deliberately written for future runs, and it carries different governance: retention, access control, and deletion. Conflating the two is a common architectural mistake, which is why the series keeps state and memory on separate definitions.
References
Numbered in order of first appearance; superscript markers in the body point here.
1. MongoDB. “Database Observability” (three-part series), MongoDB Developer Blog, 2025. https://www.mongodb.com/company/blog/innovation/mongodb-database-observability-integrating-with-monitoring-tools
2. Augment Code. “Agent Observability for AI Coding” (guide). https://www.augmentcode.com/guides/agent-observability-for-ai-coding
3. OpenTelemetry. “Semantic conventions for generative-AI agent spans.” https://github.com/open-telemetry/semantic-conventions-genai/blob/main/docs/gen-ai/gen-ai-agent-spans.md
4. Greptime. “OpenTelemetry GenAI Semantic Conventions,” May 9, 2026. https://greptime.com/blogs/2026-05-09-opentelemetry-genai-semantic-conventions
5. Datadog. “Monitor LLM applications with the OpenTelemetry semantic conventions.” https://www.datadoghq.com/blog/llm-otel-semantic-convention/
6. Watson et al. “Cognitive observability for foundation-model-based agents,” arXiv:2411.03455. https://arxiv.org/pdf/2411.03455
7. Cloudflare. “Browser Run for AI agents.” https://blog.cloudflare.com/browser-run-for-ai-agents/
8. LangChain. “Agent Observability” (LangSmith). https://www.langchain.com/resources/agent-observability
9. Hamel Husain. “A Field Guide to Rapidly Improving AI Products.” https://hamel.dev/blog/posts/field-guide/index.html
10. IBM. “What is AgentOps?” https://www.ibm.com/think/topics/agentops
11. Microsoft. “Introducing built-in AgentOps tools in Azure AI Foundry Agent Service.” https://techcommunity.microsoft.com/blog/azure-ai-foundry-blog/introducing-built-in-agentops-tools-in-azure-ai-foundry-agent-service/4414389
12. DORA. “2025 research questions,” Google Cloud. https://dora.dev/research/2025/questions/
Series: Designing an Agentic Platform
Pt 0 — Series Intro: The Infrastructure That Makes Agents Work
Pt 4 — Orchestration & Tool Use
Pt 5 — Memory Inside the Harness
Pt 6 — Agent Observability (this post)
Capstone — The Agent Platform Buyer’s Checklist
About the authors
Mikiko Bazeley, Staff Developer Advocate, MongoDB. Mikiko writes about agentic AI systems, agent memory and context engineering, and the POC-to-production gap.
Ashish Kumar, Technical Fellow, MongoDB. Ashish joined MongoDB over two years ago through the acquisition of Grainite, a database startup he co-founded. Before that, he spent many years at Google, most recently responsible for Google’s native database suite — Bigtable, Spanner, Datastore, and Firestore — across Google’s own products and Google Cloud. His passion is large-scale distributed systems, and at MongoDB he focuses on architectural improvements across the product stack.
Max Marcon, Director of Product Management, MongoDB. Max leads product for agentic AI initiatives at MongoDB. His mission is to ensure customers are successful with running agents at enterprise scale.
Charlie Xu, Senior Product Manager, AI and Emerging Products, MongoDB. Charlie focuses on products that help developers and enterprises build agents. His work spans the strategy, product experience, and architecture needed to move agents from prototype to production.
Ahmed Sulaiman, Staff Engineer, AI and Emerging Products, MongoDB. Ahmed focuses on the architecture and engineering required to move agentic AI systems from prototype to production, with an emphasis on scale, reliability, and real-world deployment.
Nandini Kapa, Software Engineer, MongoDB. Nandini focuses on the engineering and operational work required to run agentic systems reliably in production, with an emphasis on platform reliability, deployment health, and decision quality.