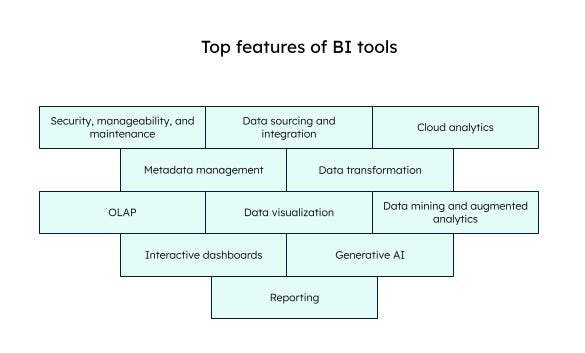
Key business intelligence software features
The best business intelligence tools have a few or more of the following features:
Security, manageability, and maintenance: BI tools provide good platform security and disaster recovery. Users can monitor usage and manage access, authorization, and authentication.
Data sourcing and integration: BI software can connect to real-time and static data from both internal and external systems—for example, spreadsheets, social media, customer relationship management (CRM) systems, data warehouses, and data lakes—integrate all the data, and analyze it together.
Cloud analytics: Many BI tools like Sisense, MongoDB Charts, and Google’s data studio are multi-cloud capable, meaning they can build, deploy, and manage analytics on multiple cloud environments. Users can visualize and explore data on the cloud platform.
Metadata management: BI software can manage metadata centrally, including extracting, storing, processing, sharing, and publishing metadata. Metadata refers to measures, indicators, hierarchies, key performance indicators, sales data, and other data that can help in business analytics.
Data transformation: BI tools automatically perform the ETL (extract, transform, load) process and prepare data for analytics. Integrity checks are done to check data accuracy and consistency. Data is transformed to a common format and then loaded into a data warehouse or data lake. Some tools, like SAS, provide AI-driven data preparation suggestions, voice integration, and smart narratives.
OLAP: OLAP is a means to sort, aggregate, filter, slice, dice, and group data to present it to users. Users can extract and view data from multiple sources. OLAP gives a multidimensional view of data and is good for analysis of past data.
Data visualization: Visualizations make it easy to find trends and insights in data through graphs, multi-layered charts, geospatial maps, custom maps, and many more. Most BI tools support advanced graphs and interactive displays, and automatically suggest the best graphical representation for a particular query.
Data mining and augmented analytics: BI tools can mine raw data to find information and wisdom in the form of patterns and trends. This includes advanced analytics and techniques like statistics and machine learning algorithms.
Dashboards: A dashboard is like a customized home page based on the role of the BI tool user. It summarizes all the reports, key business metrics, and important graphics to create data visualizations in a single view.
Generative AI: BI tools leverage generative AI for predictive analytics, automated insights, natural language queries, and custom visualizations.
Reporting: BI tools improve and automate ad hoc reporting capabilities by customizing the metrics. This means each user can look at the reports they want to, rather than generating hundreds of bulky reports. The reports can be easily shared and collaborated across the team.
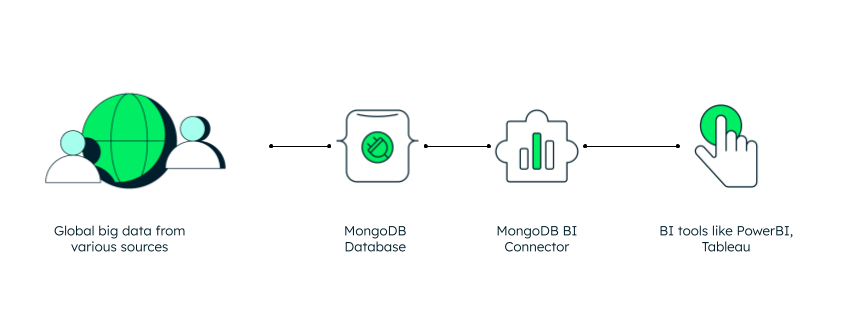
MongoDB Charts as a business intelligence tool provides all the key features like reporting, predictive analytics, dashboards, data visualization, and OLAP, all embedded into MongoDB’s cloud data service, MongoDB Atlas.
Who uses business intelligence software?
As the capabilities of business intelligence platforms are increasing, so are the users. Earlier, the major users of BI software were the business analysts and the IT team. Now, business intelligence reporting and analytics tools are used by many teams within a company. Some typical users of BI software include data analysts and data scientists who use them to find insights, visualize patterns and trends, generate and share reports with stakeholders, and help with the decision-making process. Similarly, business analysts look at dashboards, reports, and visualizations to get insights, play around with data, and discuss possible solutions to problems with stakeholders and key business partners. Even CEOs use business intelligence software and reporting tools to look for organizational trends, innovation in processes, overall company growth, and operational efficiencies, and to make better business decisions.