You can often predict a load spike before it arrives. Maybe it happens at the same time every day, or there’s always a spike at midnight on a Friday when you run a certain batch job. Or maybe it’s not cyclical, but load is rising steadily, and it’s a reasonable guess that it will keep rising for a while. MongoDB Atlas’s reactive auto-scaler handles these spikes, but scaling to the right size takes several minutes. What if MongoDB Atlas could use these temporal patterns—cycles and trends—to scale up a replica set before it’s overloaded?
In 2023, we prototyped predictive auto-scaling. We wanted to see if it was possible to predict rises and falls in load on MongoDB Atlas replica sets. We researched which machine learning models made the best predictions, and estimated how much a predictive auto-scaler could improve performance and save our customers money.
MongoDB has now rolled out predictive auto-scaling. The production version of the algorithm is quite different from the prototype, and so far, it only scales replica sets up before a predicted load spike; we rely on the existing reactive algorithm to scale them down afterward. Now that predictive auto-scaling is in production, we want to look back at the research project that started it.
MongoDB Atlas
MongoDB is free and source-available, you can download it and deploy a database yourself, and lots of people do. But many customers use our cloud service, MongoDB Atlas. Atlas customers decide how many MongoDB servers to deploy in Atlas, what cloud providers and regions to deploy them in, and what size of server: how many CPUs, how much RAM, and so on. Each server in a replica set must use the same tier. (With exceptions.) We charge customers according to their choices, including how many servers, what size, and how many hours they're running. Of course, we compensate our cloud providers (including AWS, Microsoft Azure, and Google Cloud) according to the number and size of servers. We sell MongoDB server sizes as a set of "tiers"—named M10, M20, and so on—which map to specific instance sizes in each cloud provider.
If we could anticipate each customer's needs and perfectly scale their servers up and down, according to their changing demands, that would save our customers money and reduce our carbon emissions.

Back in 2023, MongoDB Atlas’s autoscaling was only reactive. The reactive auto-scaling algorithm scales up after a few minutes of overload, or a few hours of underload. It only scales between adjacent tiers; for example, if an M60 replica set is underloaded, Atlas will scale it down to M50, but not directly to any tier smaller than that. If the customer's demand changes dramatically, it takes several scaling operations to reach the optimum server size. This means servers can be overloaded or underloaded for a while. An underloaded server costs the customer more than necessary. An overloaded server is bad for performance, and if it's really slammed, it could interfere with the scaling operation itself.
The reactive algorithm wants to keep replica sets the perfect size. But it doesn’t react instantly to every change, because it also wants to avoid scaling too frequently. Besides, no matter how quickly the algorithm reacts, the scaling operation itself takes a few minutes to change the replica set’s server sizes. To radically improve auto-scaling, we needed an algorithm that could see the future.

Predictive auto-scaling
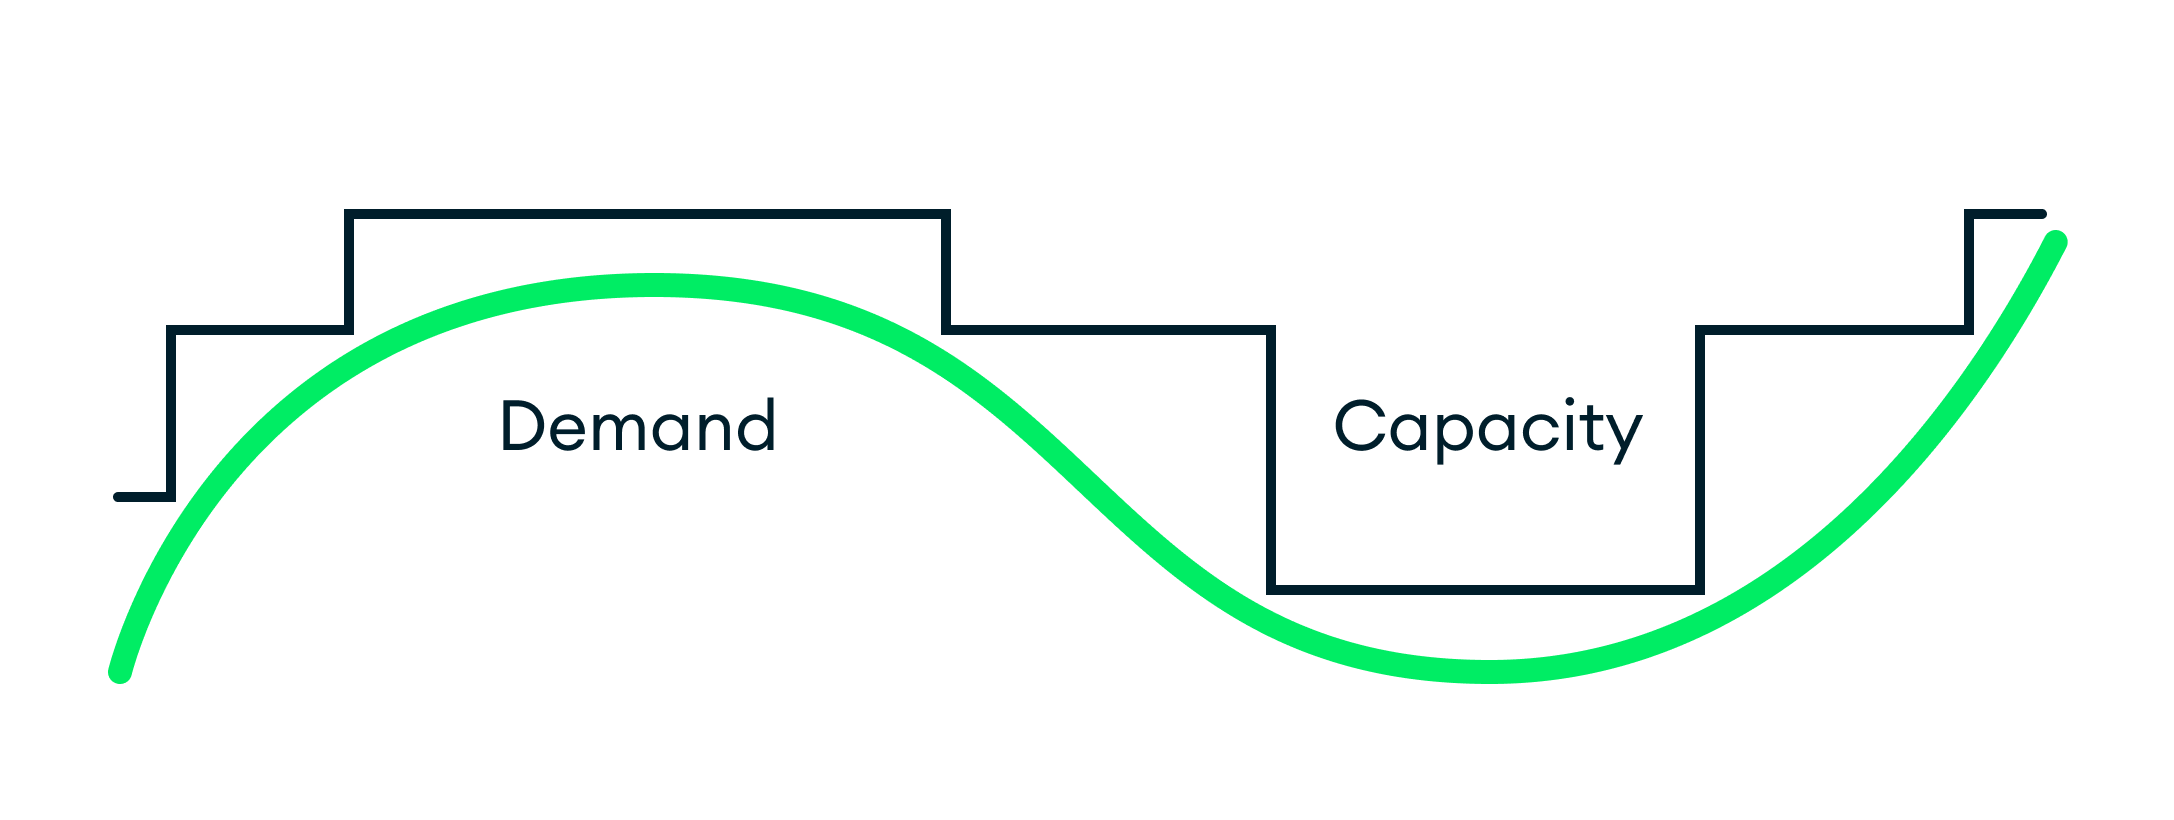
We envisioned an algorithm that would forecast each replica set's resource needs. We could scale a replica set up just before it's overloaded, and scale it down as soon as it's underloaded. We would scale it directly to the right server size, skipping intermediate tiers. We'd always use the cheapest size that could meet demand.
Figure 1. An imaginary perfect auto-scaling algorithm.
Predictive scaling experiment
We hypothesized that there existed some forecasting algorithm that could predict customers’ workload changes, with enough accuracy and foresight to outperform the reactive auto-scaler. We experimented with a variety of algorithms to test whether this was worth building for MongoDB Atlas.
The experiment was possible because Atlas keeps servers' past performance metrics. For a random selection of 10,000 replica sets, we split the history into a training period and a testing period, as usual with machine learning, and trained models to forecast the replica sets' demand and CPU utilization. (CPU is the simplest and most important metric; eventually, we could forecast RAM, disk I/O, and so on.)
Once we'd prototyped this predictive scaler, we estimated how it would've performed during the testing period, compared to the reactive scaler that was running at that time. The prototype had three components:
Forecaster: tries to predict each replica set's future workload
Estimator: estimates CPU% for any workload, any instance size
Planner: chooses the cheapest instance that satisfies forecasted demand
Figure 2. Components of the predictive auto-scaling experiment.
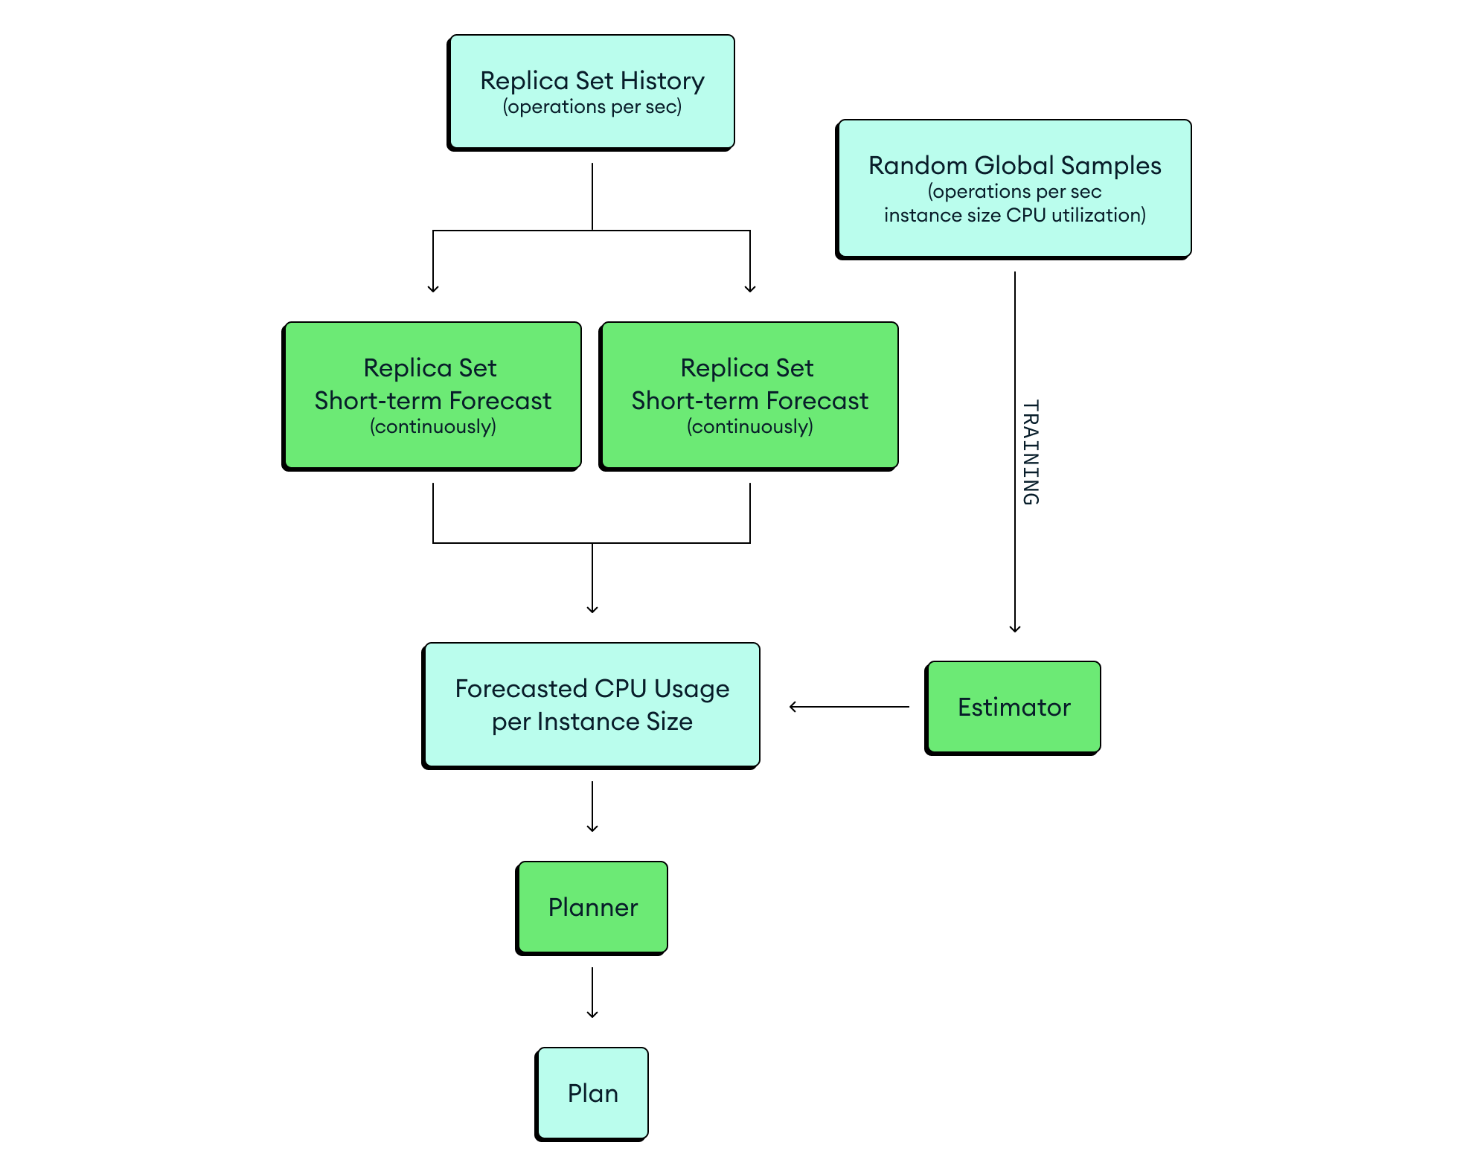
For each replica set, its history is an input to the Short-Term and Long-Term Forecasters. (We'll explain why we have two Forecasters soon.) The Forecasters must be retrained every few minutes, as new samples arrive. We sampled 25 million points in time from random replica sets in MongoDB Atlas. Each of these samples includes a count of operations per second, an instance size, and the CPU utilization at that moment. We used this to train the Estimator, which can predict the CPU utilization for any amount of customer demand and any instance size. This is a hard problem, since we can't see our customers' queries or their data, but we did our best. The Estimator must be retrained rarely, when there's new hardware available, or a more efficient version of the MongoDB software. (Eventually we plan to train an Estimator for each MongoDB version.)
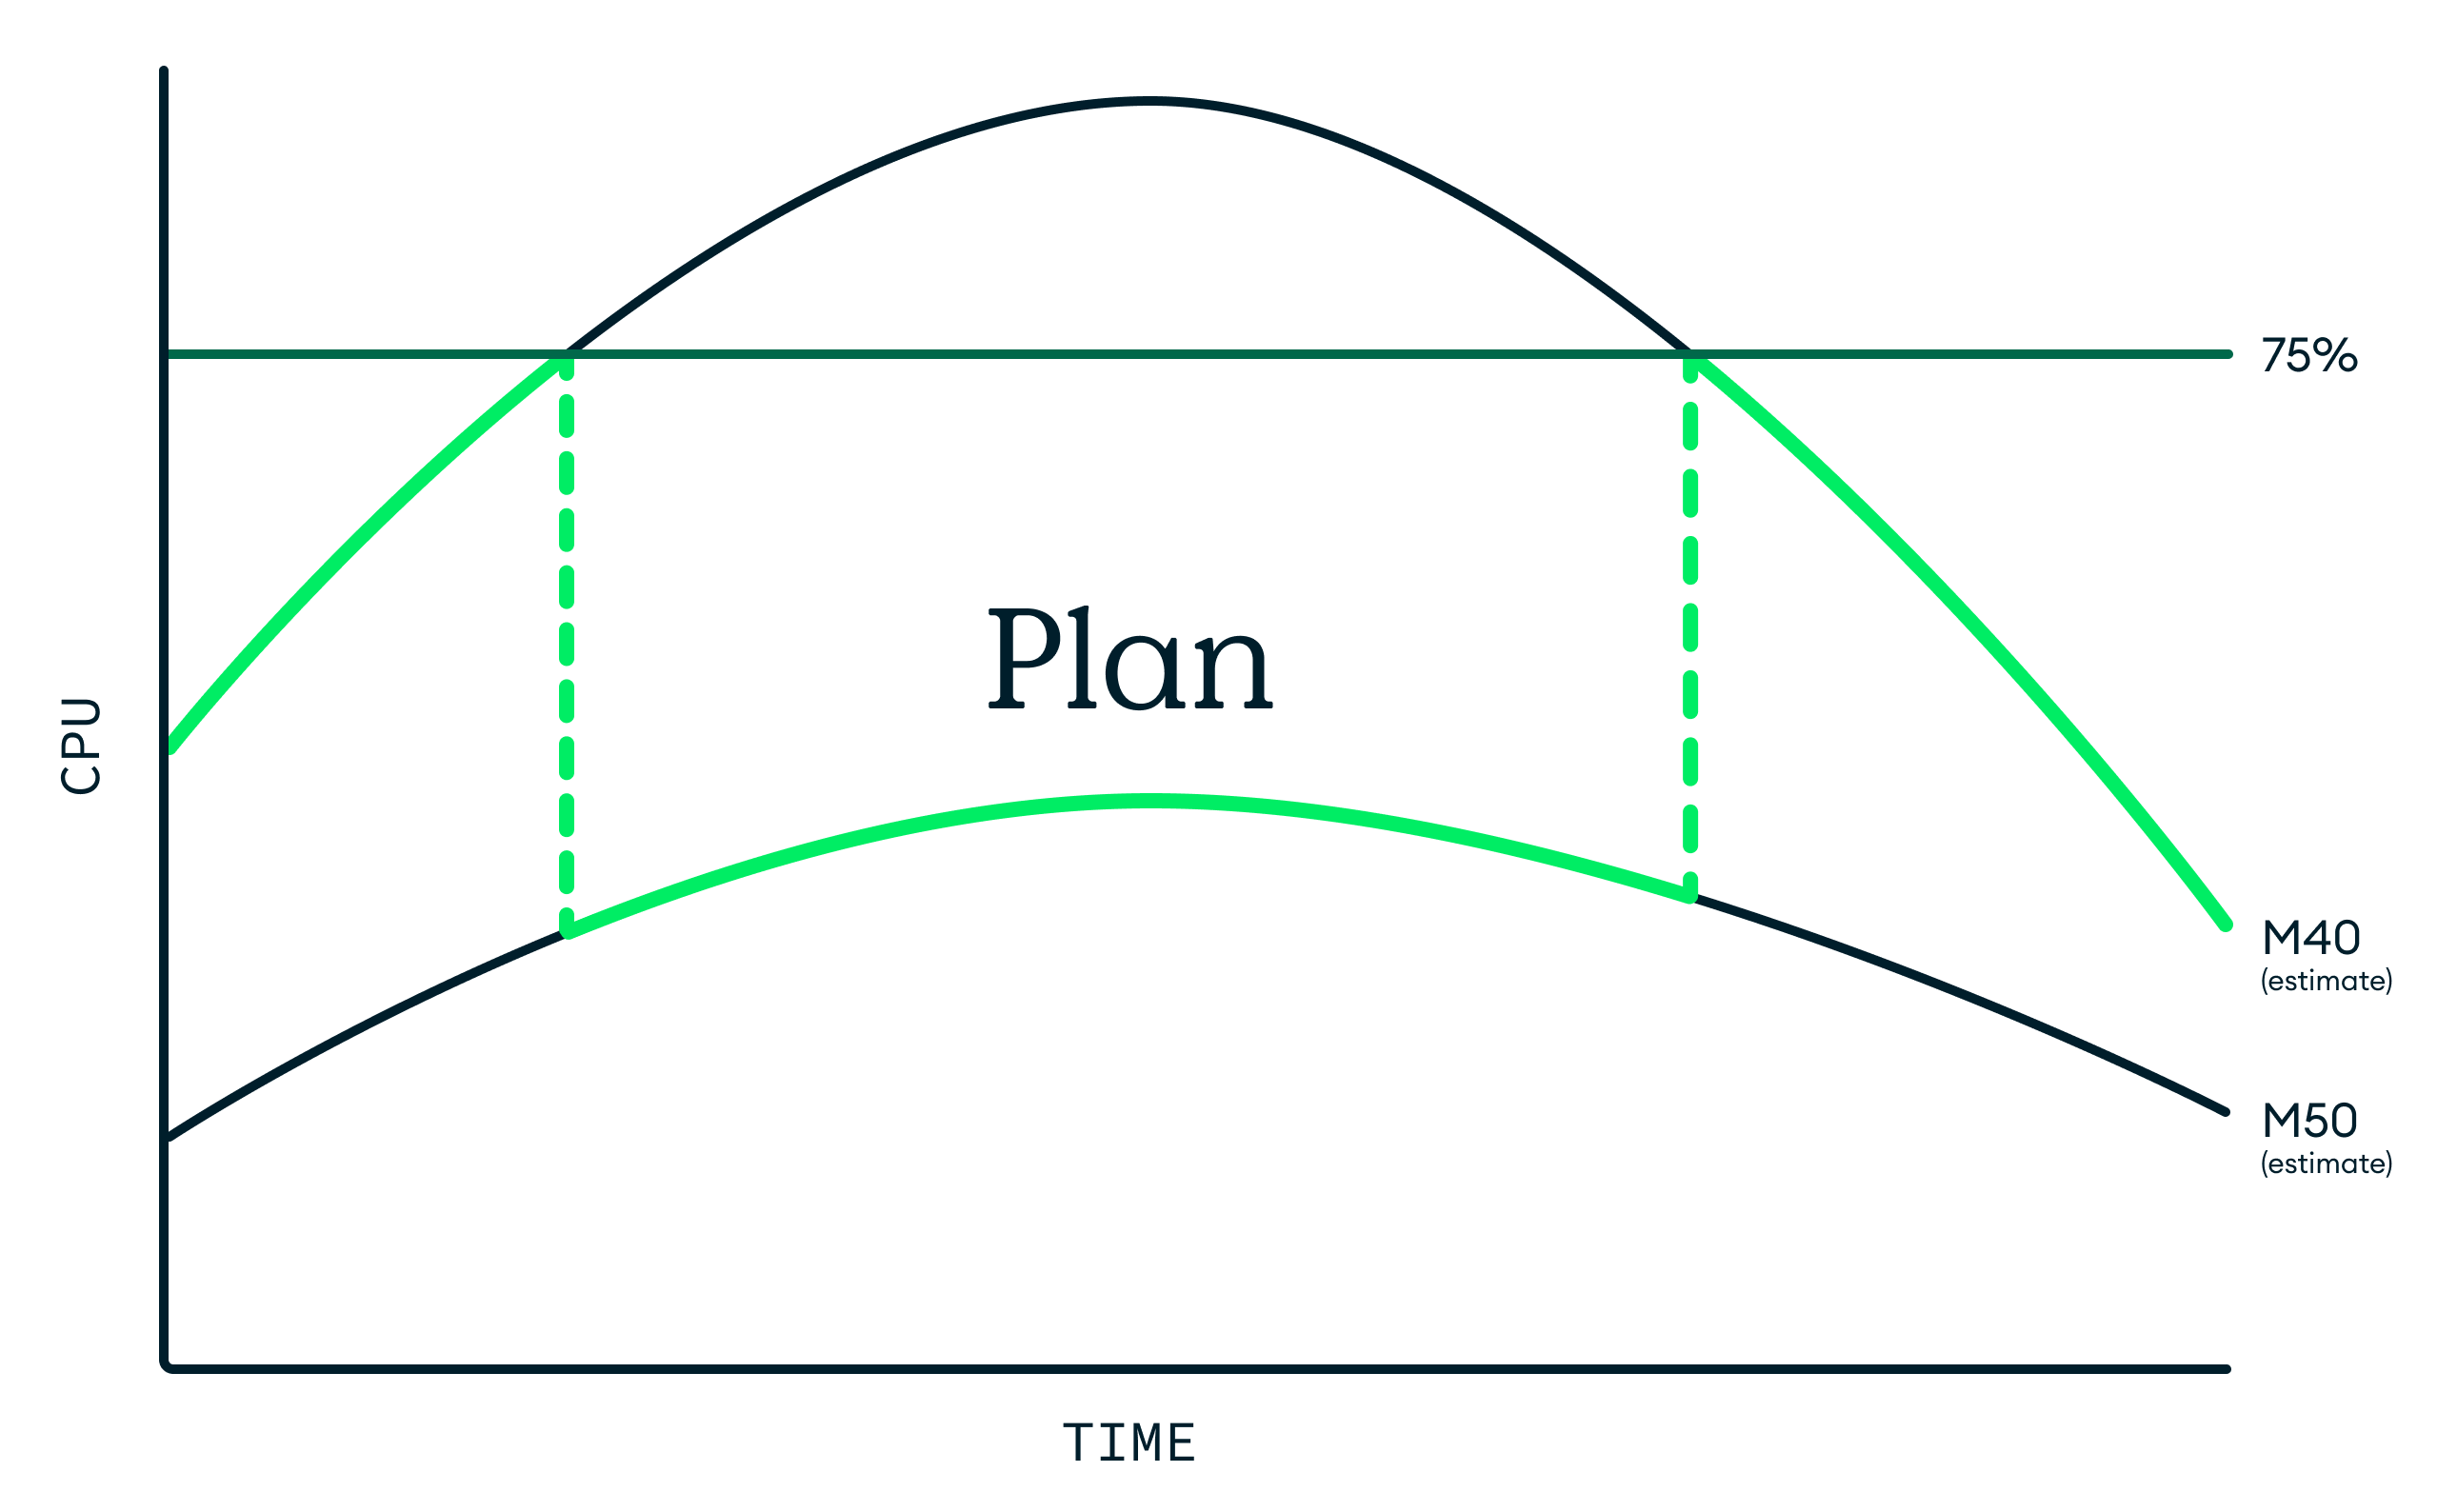
The Forecasters and Estimator cooperate to predict each replica set's future CPU on any instance size available. For example, they might predict that 20 minutes in the future, some replica set will use 90% CPU if it's on M40 servers, and 60% CPU if it's on more powerful M50 servers.
Predictive scaling: Planner
Let's look at the Planner in more detail. Here's a forecasted workload; it's forecasted to rise and then fall.
Figure 3. Adjusting server size just in time.
Predictive scaling: Long-term forecaster
Our goal is to forecast a customer's CPU utilization, but we can't just train a model based on recent fluctuations of CPU, because that would create a circular dependency: if we predict a CPU spike and scale accordingly, we eliminate the spike, invalidating the forecast. Instead we forecast metrics unaffected by scaling, which we call "customer-driven metrics"—e.g., queries per second, number of client connections, and the scanned-objects rate. We assume these are independent of instance size or scaling actions. (Sometimes this is false; a saturated server exerts backpressure on the customer's queries. But customer-driven metrics are normally exogenous.)
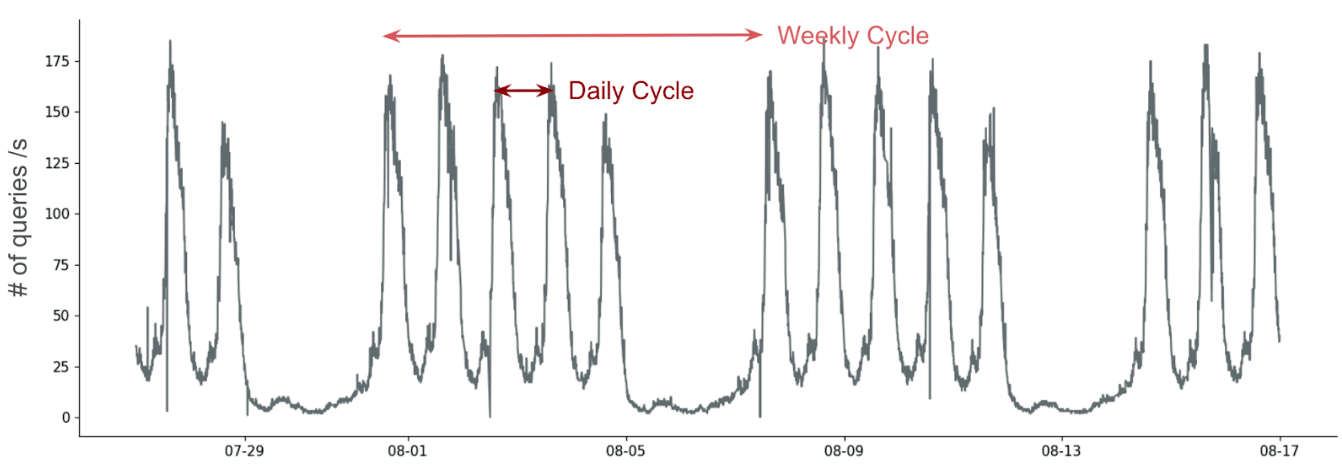
Figure 4. Predicting seasonal variations in demand.
Our forecasting model, MSTL (multi-seasonal trend decomposition using LOESS), extracts components from the time series for each customer-driven metric for an individual replica set. It separates long-term trends (e.g., this replica set's query load is steadily growing) and "seasonal" components (daily and weekly) while isolating residuals. We handle these residuals with a simple autoregressive model from the ARIMA family.
Figure 5. MSTL (multi-seasonal trend decomposition using LOESS).
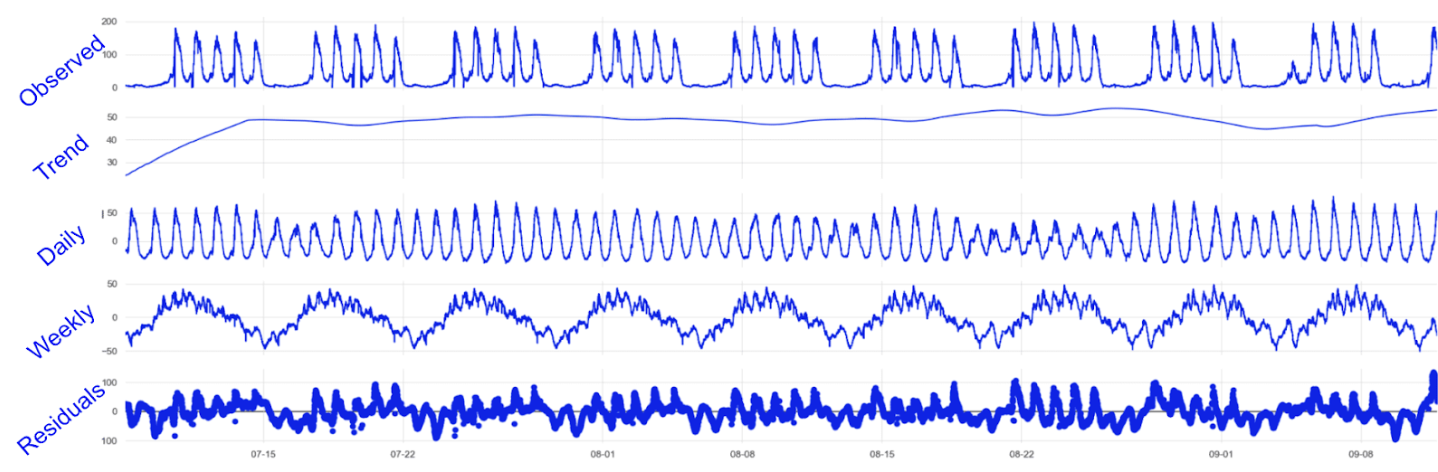
By combining these components, we forecast each metric separately, creating a "Long-Term Forecaster" for each. Despite the name, the Long-Term Forecaster doesn't project far into the future; it's trained on several weeks of data to capture patterns, then predicts a few hours ahead.
Figure 6. How often is demand seasonal?
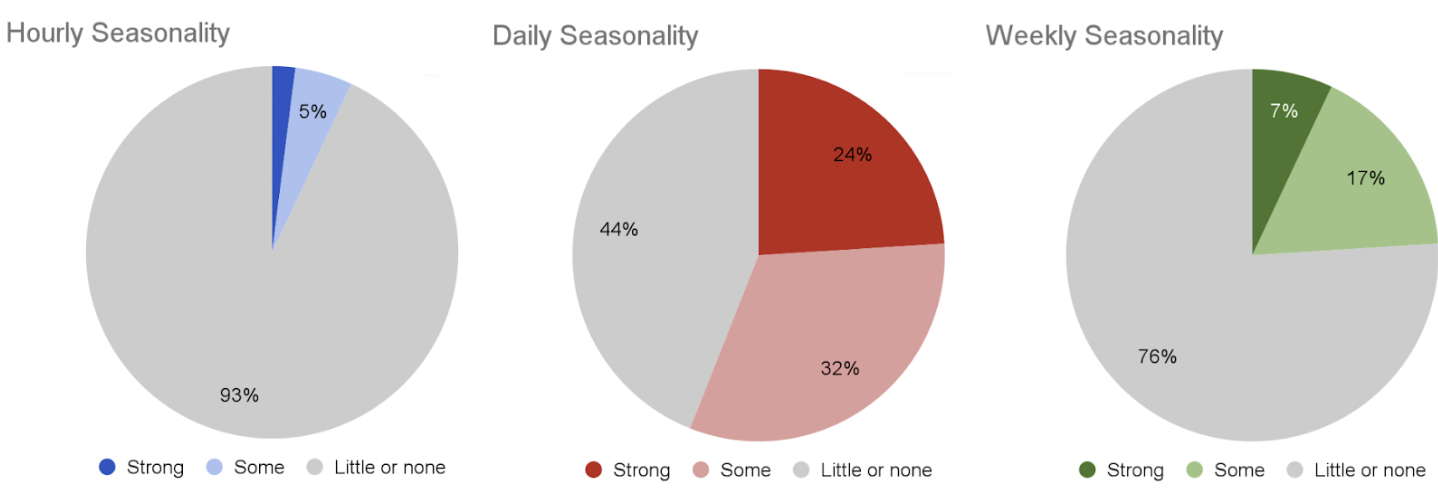
Most MongoDB Atlas replica sets have daily seasonality. About 25% have weekly seasonality. Generally, if a replica set has weekly seasonality, it also has daily seasonality. Hourly seasonality is rare, and anyway, it isn't helpful for planning a scaling operation that takes a quarter-hour. Replica sets with sufficient daily/weekly seasonality are predictable by the Long-Term Forecaster.
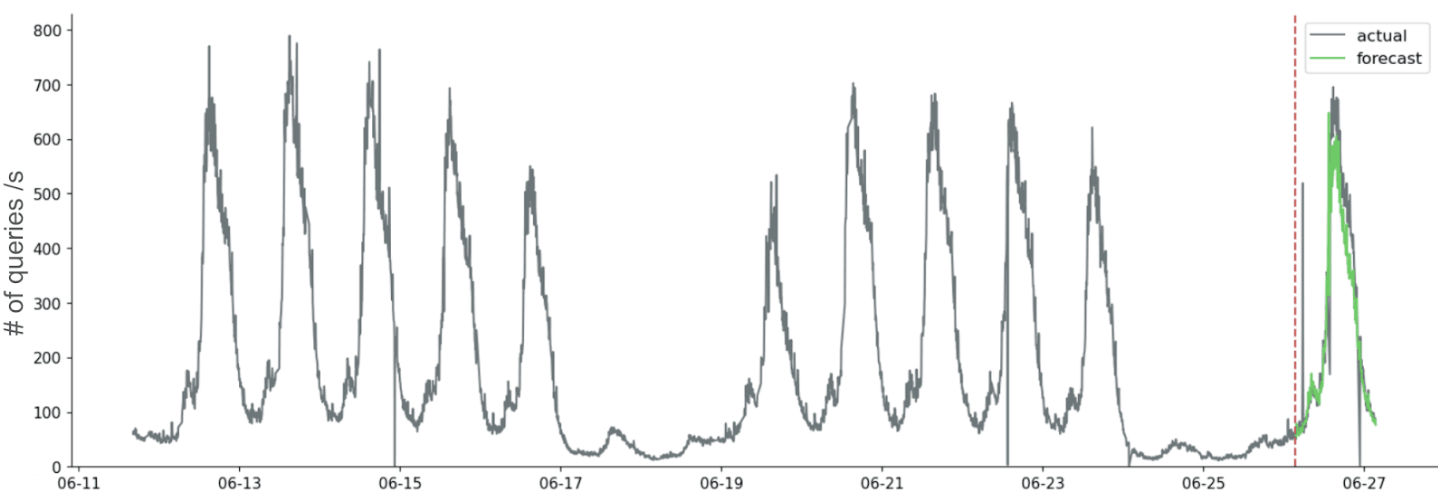
In the chart below, the long-term forecaster learns from the previous two weeks of data (left of the vertical dotted red line) and accurately predicts the next few hours (prediction in green on the far right).
Figure 7. Example “long-term” forecast.
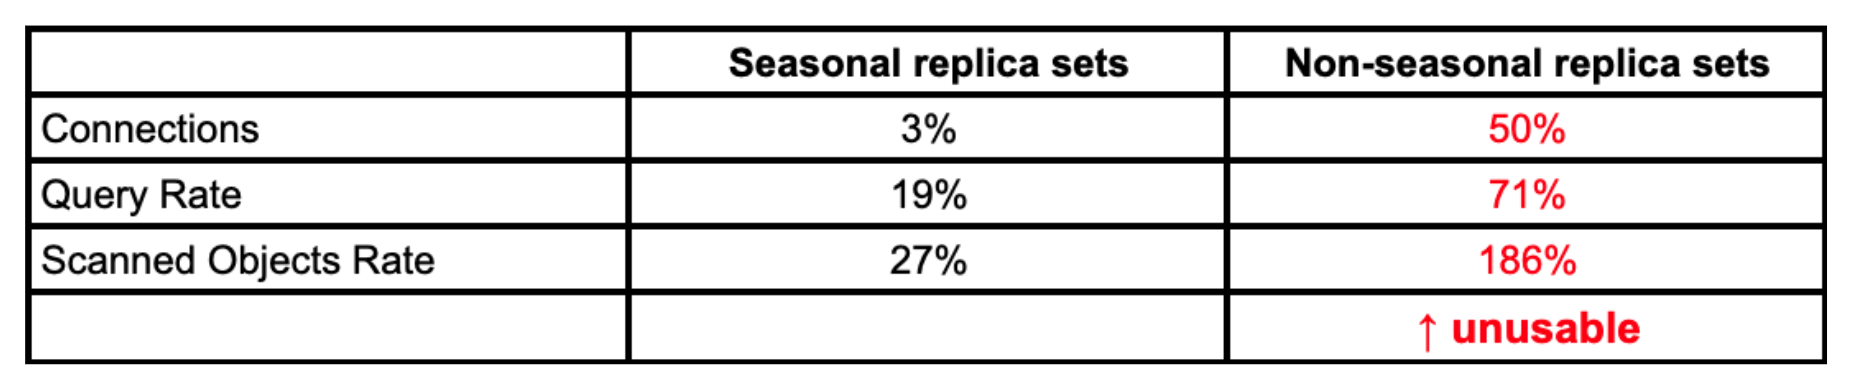
But only some replica sets have seasonality! For non-seasonal replica sets, the Long-Term Forecaster's prediction of customer-driven metrics is unusable.
So we added a "self-censoring" mechanism to our prototype: the Long-Term Forecaster scores its own confidence based on its recent accuracy, and only trusts its prediction if its recent error has been small.
Predictive scaling: Short-term forecaster
What can we do when the Long-Term Forecaster isn't trustworthy? We didn't want to fall back to purely-reactive scaling; we can still do better than that.
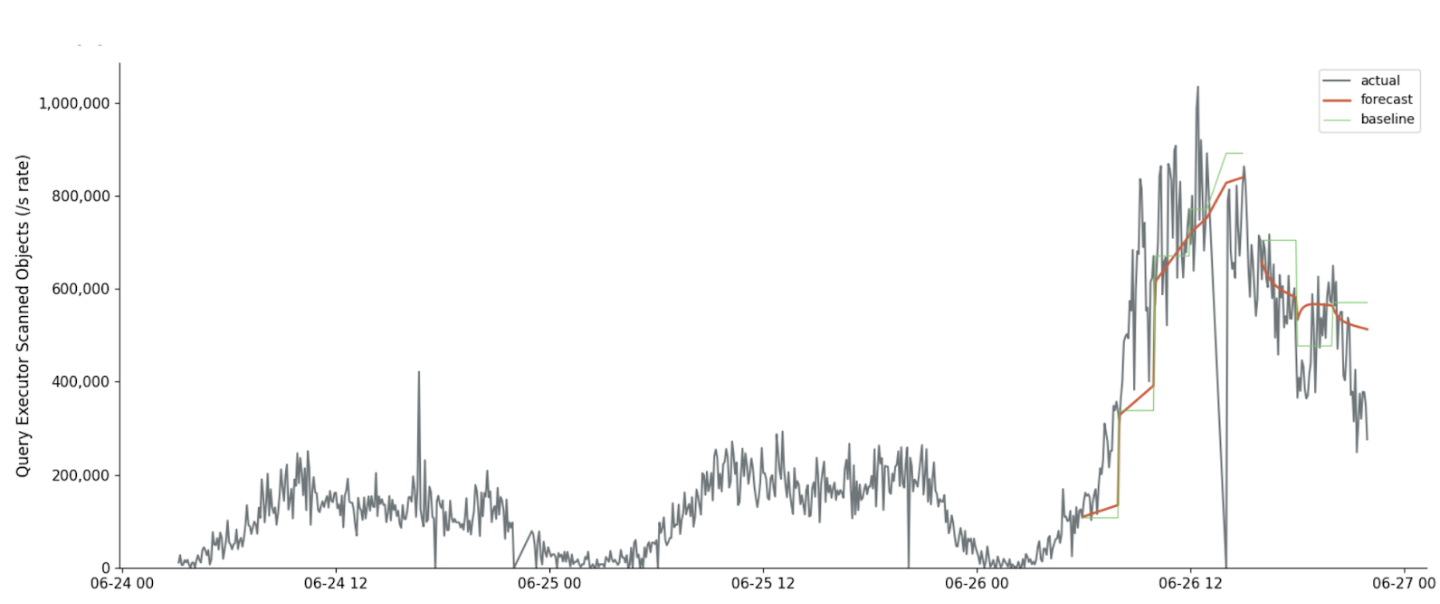
So we prototyped a "Short-Term Forecaster"; this model uses only the last hour or two of data and does trend interpolation. We compared this to a naïve baseline Forecaster, which assumes the future will look like the last observation, and found that trend interpolation beats the baseline 68% of the time (29% reduction in error).
Figure 8. Approximation of local trends for near-future forecast.
Predictive scaling: estimator
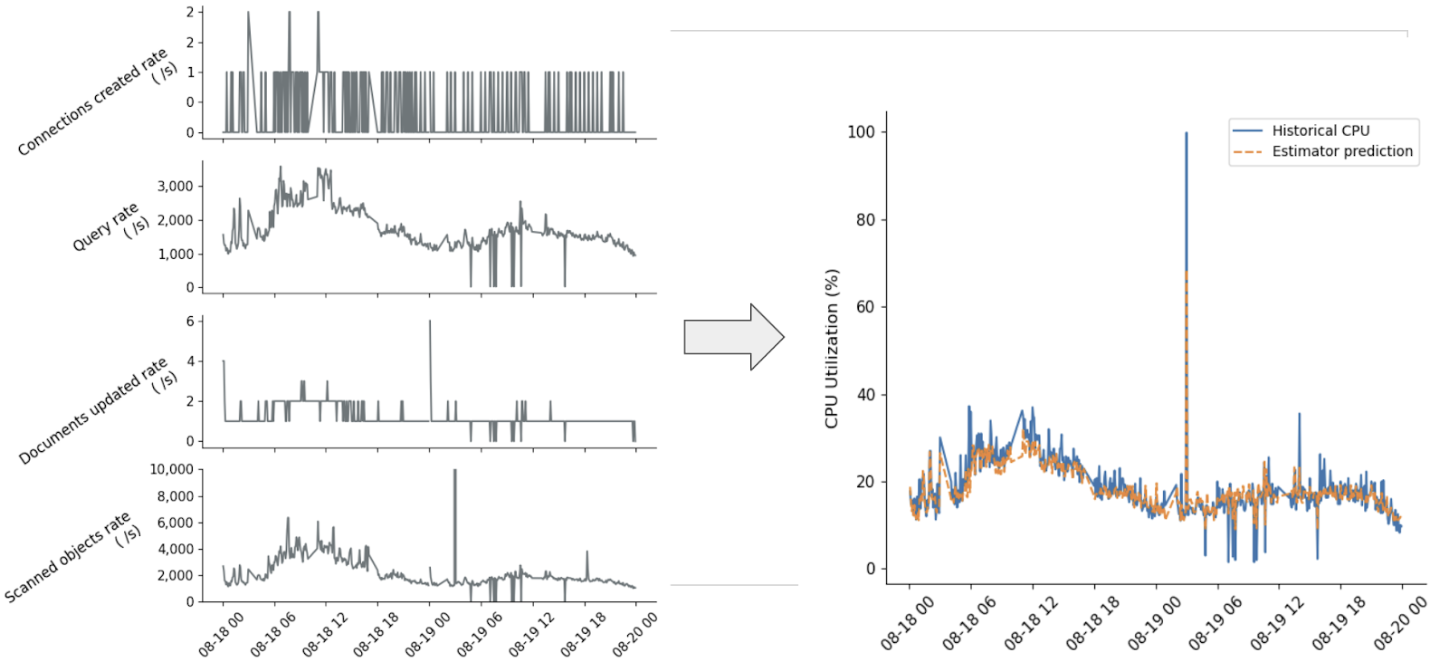
The Forecasters predict customer demand, but we still need to know whether CPU utilization will be within the target range (50-75%). That's the Estimator's job. The Estimator takes the forecasted demand and an instance size (defined by CPU and memory), and outputs the projected CPU.
Using a regression model based on boosted decision trees trained on millions of samples, we've achieved fairly accurate results. For around 45% of replica sets, our error rate is under 7%, allowing us to make precise scaling decisions. For another 42%, the model is somewhat less accurate but useful in extreme cases. We exclude the remaining 13% of replica sets with higher error rates from predictive scaling.
Figure 9. Example of input and output of Estimator.
Predictive scaling: Putting it all together
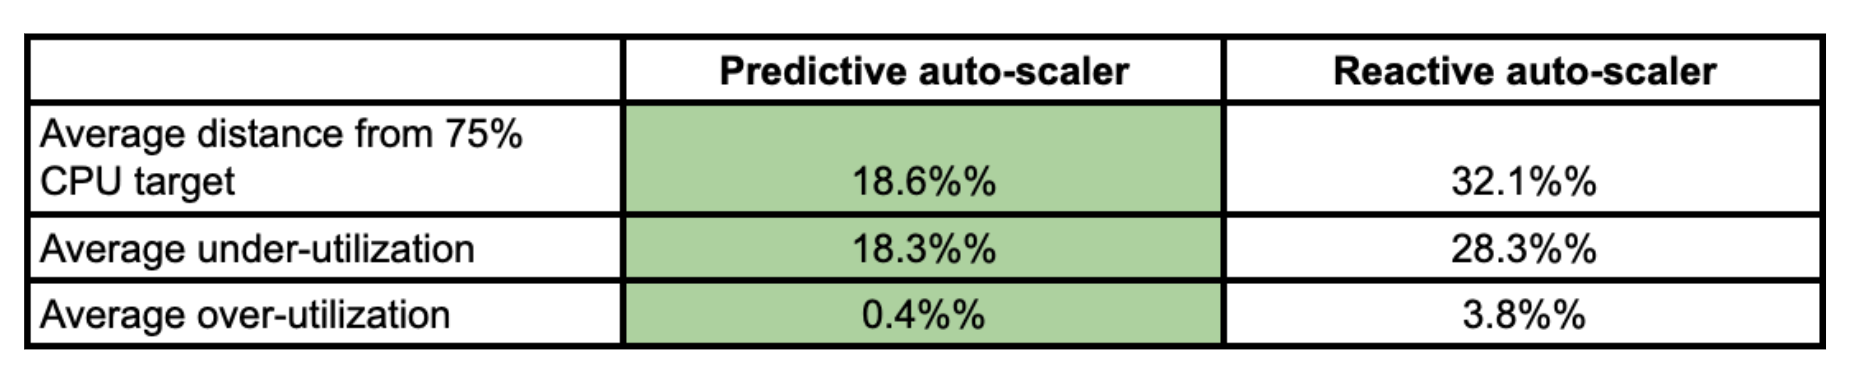
With both forecasts and CPU estimates, the Planner can choose the cheapest instance size that we guess can handle the next 15 minutes of customer demand without exceeding 75% CPU. Our experiment showed that this predictive scaler, compared to the reactive scaler in use during the test period, would've stayed closer to the CPU target and reduced over- and under-utilization. For the average replica set it saved 9 cents an hour. That could translate to millions of dollars a year if the predictive scaler were enabled for all MongoDB Atlas users.
Predictive auto-scaling in production
Our experiment showed that predictive auto-scaling could work in MongoDB Atlas, and we learned important facts: only some replica sets are predictable, and short-term trends are often better signals than daily and weekly cycles.
In the two years since, MongoDB has used these results to develop a production-grade predictive auto-scaler. The algorithms are different, and the code is new—the experiment is more of a godparent to the product, rather than its parent. In November 2025, we began rolling it out in MongoDB Atlas. All customers who enabled auto-scaling (about a third) will soon have both predictive and reactive auto-scaling. This first version is conservative, it only uses predictions to scale replica sets up. If load declines, the reactive auto-scaler will scale the replica set back down after a few hours.
We’re proud that MongoDB’s research and data science teams have contributed an Atlas feature that will help tens of thousands of customers, and we’re excited to see how the predictive auto-scaler evolves.

Further Reading
- This work was heavily inspired by Rebecca Taft's PhD thesis
- Also interesting: Is Machine Learning Necessary for Cloud Resource Usage Forecasting?, ACM Symposium on Cloud Computing 2023
- MongoDB Atlas
- Cycling images from Public Domain Review