Big data analytics is the complex process of examining massive, diverse datasets to uncover hidden patterns, correlations, and market trends that drive strategic business decisions. But before data can be used for analysis, it has to be cleaned, organized, and parsed. Once it's ready, advanced statistical models, machine learning, and queries can find patterns and relationships that can be extracted for business intelligence (BI). Today, artificial intelligence (AI) handles much of this work, especially cleaning up the data. It also lets businesses ask analytical questions in plain English (called natural language processing, or NLP) instead of using complex structured query language (SQL) code or hiring a data analyst.
Key takeaways
- Big data analytics finds patterns in a company's data, such as customer activity, and devices, operations, so it can be used for strategic business decisions.
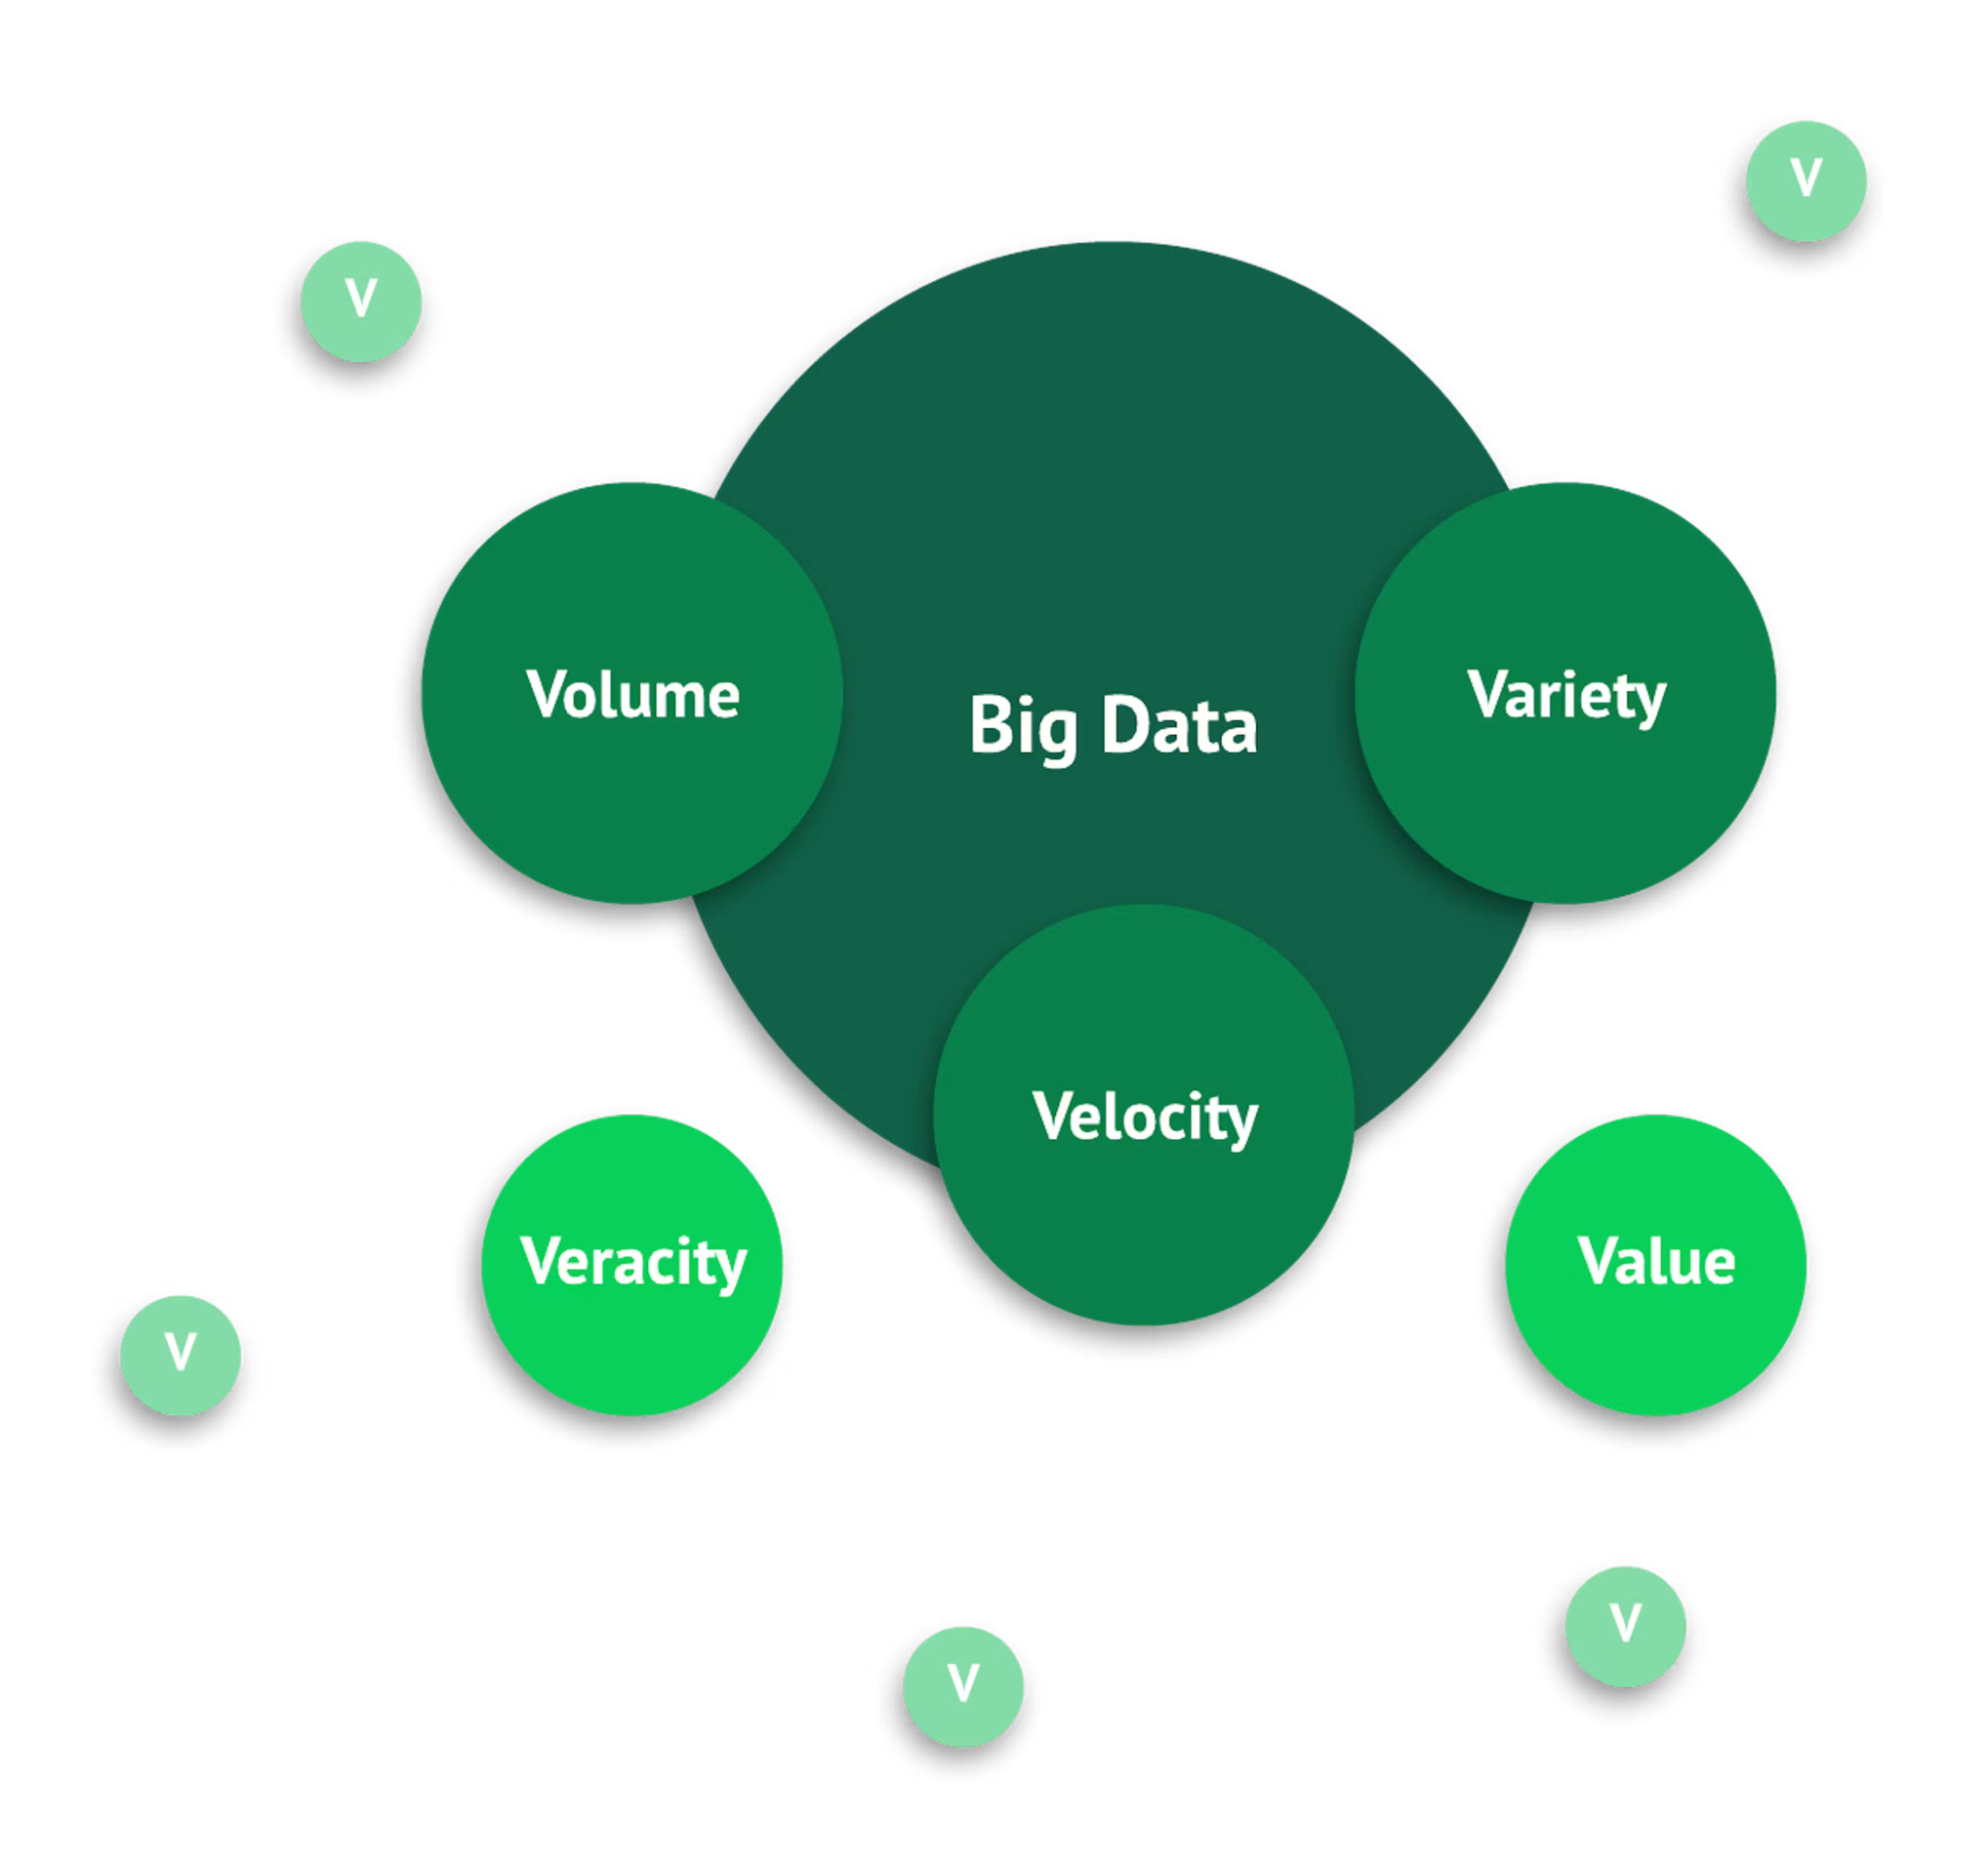
- The five Vs (volume, velocity, variety, veracity, value) describe big data's size, speed, mix, trustworthiness, and payoff—the qualities that make it harder to handle than typical data.
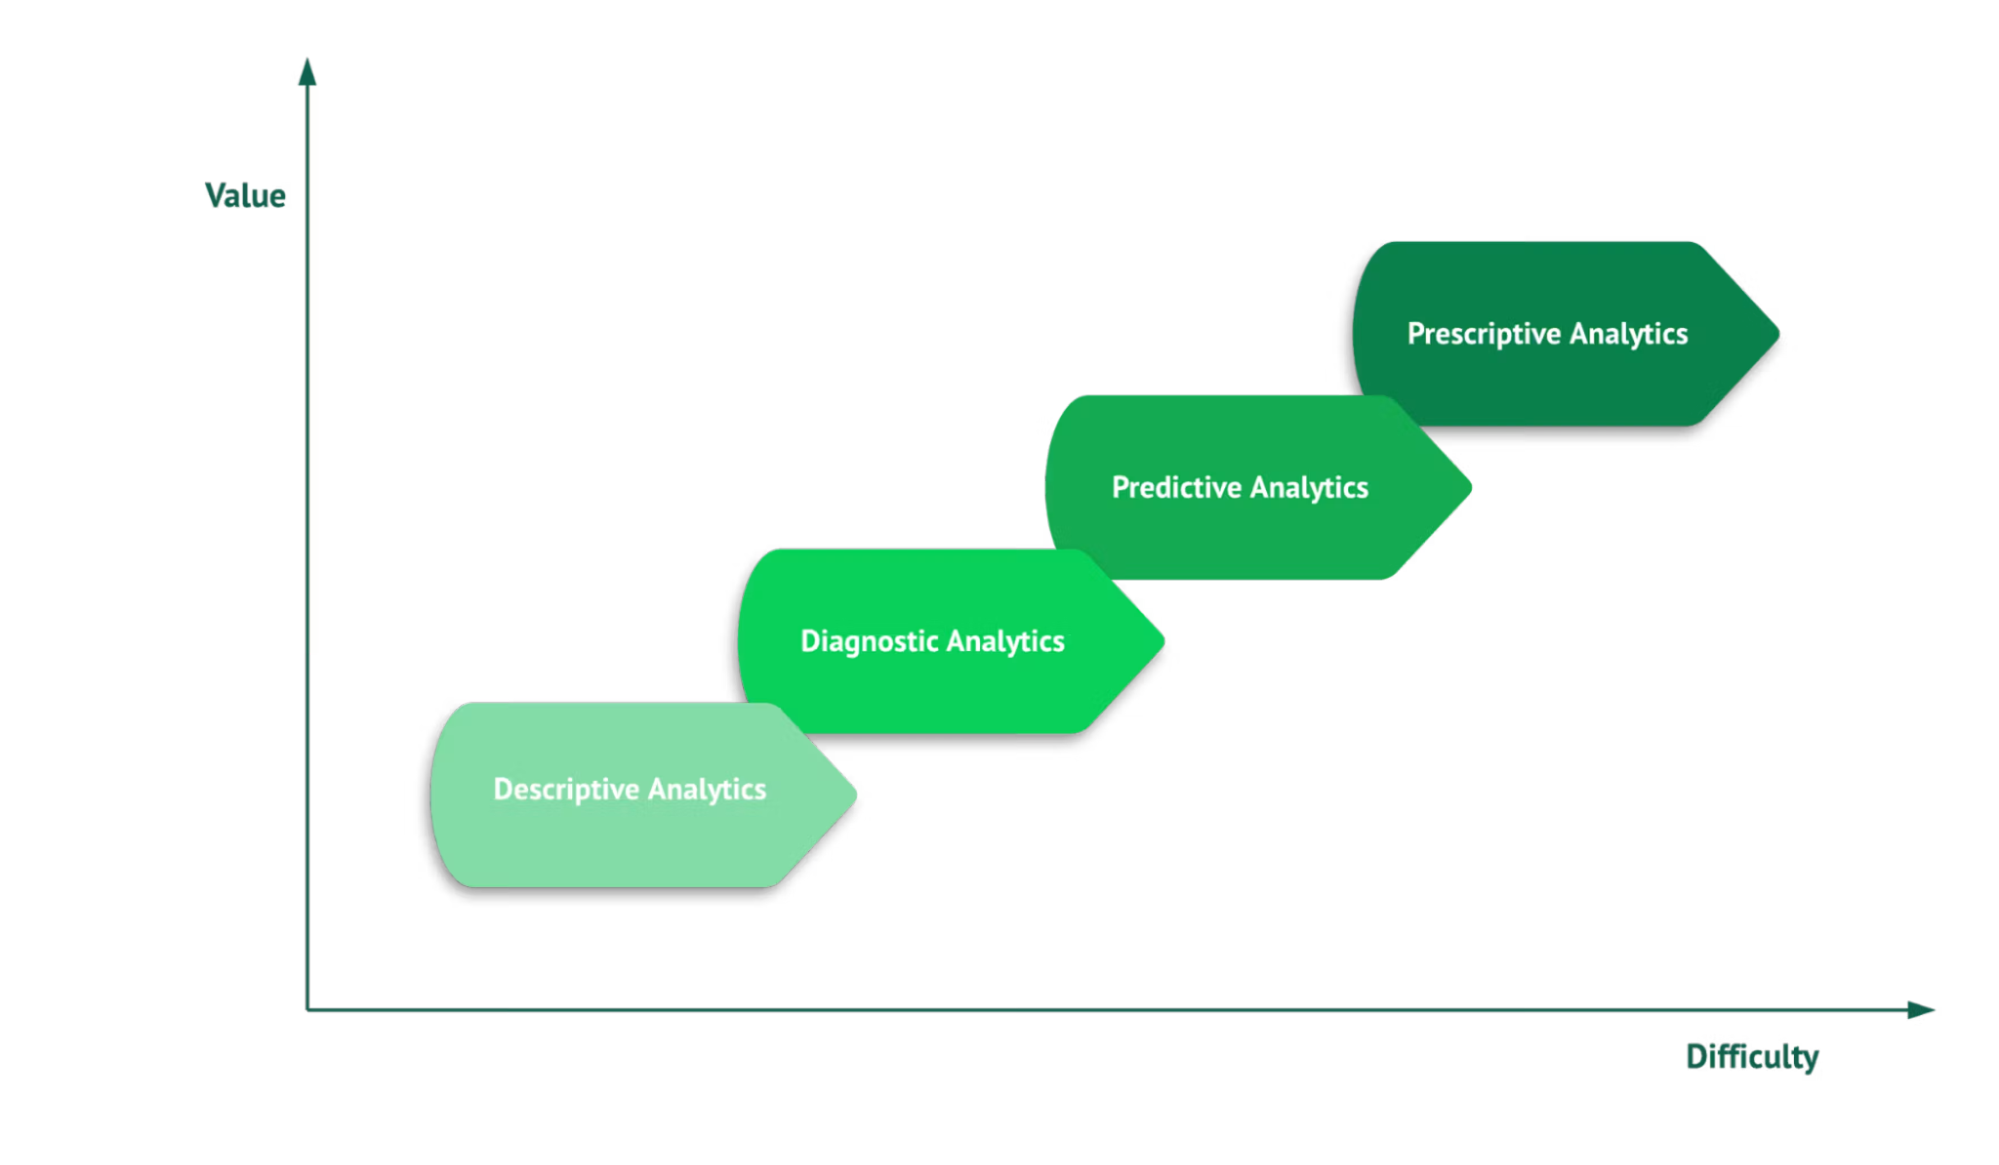
- The four types of big data analytics—descriptive, diagnostic, predictive, and prescriptive—answer what happened, why, what's next, and what to do.
- Real-time analysis used to be specialized, but now it's standard for fraud detection, personalization, and operations.
- MongoDB Atlas covers the storage, queries, streaming, and vector search big data analytics depends on.
Table of contents
- Why is big data analytics important?
- What are the five "Vs" of big data analytics?
- How does big data analytics work?
- Four questions big data analytics answers
- Big data analytics tools and technologies
- What are the challenges to implementing big data analytics?
- Where MongoDB Atlas fits in with big data analytics
- Conclusion
- Related resources
Why is big data analytics important?
Your company, like many companies today, is probably collecting structured, semi-structured, and unstructured data from many different sources—video, audio, emails, social media, connected devices, and texts. But if it's just sitting in your databases, it's not providing you or your customers any value. Big data analytics can give you a competitive advantage because it replaces a gut feeling with evidence-based reasoning, often speeding up decisions from days to minutes.
The most common payoffs of a big data analytics program include:
Faster decision-making: If data is current and accessible, your employees are more likely to use it to make the right decisions.
Smarter spending: When you can see what's working—and not working—in real time, it's easier to make the best marketing, inventory, and operations budget decisions.
A better customer experience: If you keep a constant eye on customer behavior through big data analytics, it's easier to notice unexpected changes in customer behavior that need your attention.
Earlier warnings: Monitoring patterns in real-time means you can catch a fraudulent transaction, a machine about to fail, or a customer about to cancel—before they impact your operations.
New opportunities: When you can see customer behavior, market trends, and operational data in one place, the opportunities become obvious—a missing product, an underserved customer, a market about to shift.
What are the five "Vs" of big data analytics?
The five “Vs”—volume, velocity, variety, veracity, and value—describe what makes big data different from data in a spreadsheet or a typical database, and they guide how big data is collected, stored, and analyzed.
Volume refers to the size of all data combined. Big data analytics handles terabytes or petabytes of information, which is typically more than a single server can hold. For example, it could include a customer's transaction history, a social platform's user activity, and a manufacturer's sensor data.
Velocity is the speed of the incoming and outgoing data. Some data, like monthly reports, trickles in. Other data, like a stock exchange, a connected car, a fraud-detection system, floods in. Velocity describes how fast data is created and transmitted—and how quickly you act on it.
Variety concerns how diverse the data is. There are several kinds of big data—structured data that fits neatly into rows and columns, plus more complex data like photos, videos, chat logs, voice recordings, and emails that don't work well with traditional table-based databases.
Veracity focuses on the trustworthiness of data. Is it clean, complete, and reliable? Big data is often messy and veracity is the pillar that makes sure your data is solid.
Value is the payoff. The ultimate goal of turning big data into meaningful business outcomes or scientific breakthroughs is creating value.The previous four Vs describe the data. Value describes the results—the patterns, predictions, and decisions that move your business forward.
Use case: Bob's shopping experience at StyleHub
Bob visits StyleHub looking for a specific T-shirt. It's out of stock.
StyleHub immediately shows him 20 similar T-shirts based on his style and past purchases.
Bob buys three of the suggested shirts.
A few days later, StyleHub notifies him that the original T-shirt is back in stock. He buys that one, too.
From Bob's side, the StyleHub experience feels personal and easy. Behind the scenes, it's the five Vs at work.
Volume: StyleHub has volumes of data on Bob—years of purchase history, browsing activity, and clicks. They also have data on millions of customers just like him.
Velocity: StyleHub collects data in milliseconds. When Bob's original choice is out of stock, StyleHub returns other options for him immediately because they know what he—and people like him—prefer.
Variety: StyleHub saves all of Bob's data in a variety of different formats, including his transactions, product reviews, saved items, and social posts he's tagged them in.
Veracity: Some of the data that StyleHub collects is clean, but some of it isn't—a typo in a review, a duplicate account, an item he returned. StyleHub has to weed out the bad data before they can use it in any capacity.
Value: An item out of stock could have led to a lost sale. Instead, StyleHub turned it into four sales and a return visit. That's because the previous four Vs—volume, velocity, variety, and veracity—worked together, thanks to big data analytics.
Learn more about big data examples and use cases.
How does big data analytics work?
How data is collected
Big data analytics starts by collecting big data from many different sources—structured, semi-structured, and unstructured.
Where the data comes from:
Social media
Radio-frequency identification (RFID) tags
Images, videos, and audio
Cloud and mobile applications
Where data is stored
Data has to go somewhere. The most common destinations are:
NoSQL databases, like MongoDB.
Data lakes, like MongoDB Atlas Data Lake.
Lakehouses, which combine warehouse structure with lake-style flexibility.
For larger systems, MongoDB often works alongside other tools—Hadoop, Spark, cloud storage—to handle storage, integration, and distributed processing across a cluster.
How data is cleaned
Raw and unstructured data is rarely clean. It comes with duplicates, missing values, outliers, extra spaces, and other inconsistencies that have to be fixed before analysis can begin. Statistical tools, automated scripts, and AI handle most of the tedious work, such as filling in missing values, flagging anomalies, and standardizing data.
How data is processed
After cleaning, the next step is data processing—where the data gets organized and split for analysis. Two main approaches are batch processing and stream processing.
Batch processing is used when decisions don't have to happen immediately. Data analysis can run overnight or at a predetermined time. Examples include daily sales reports and monthly billing.
Stream processing is used when data needs to be processed as soon as possible. As data flows into the pipeline, it's processed in small chunks instead of waiting for batch processing later. Fraud detection, stock market alerts, and real-time product recommendations all run on streams. Stream processing tools handle time-series data well, such as real-time sensor readings, transactions, and log files. In 2026, streaming is the default expectation for any analytics work where fresh data is a priority.
How data is analyzed
Finally, it's time for analyzing data—from simple reports to advanced analytics like predictive models and AI. The most common method of data analytics are:
Data mining: Finds patterns and relationships in the data. For example, noticing that customers who buy a tent often add a sleeping bag to the same order, so the retailer can suggest one when the other is in the cart.
Statistics and machine learning: Starts with basic measures like mean, standard deviation, and correlation, then builds up to predictive models. For example, travel companies that estimate the best time to book flights and hotels are using machine learning based on past pricing trends.
Deep learning: Uses neural networks to find patterns in messier, more abstract data, such as images, voice, and language. Voice assistants and most modern recommendation engines rely on it.
Four questions big data analytics answers
After the data is collected, stored, cleaned, and processed, it's ready to answer four types of questions.
Descriptive analytics answers “what happened”—last quarter's sales, this month's churn rate, and who bought what. This is the foundation of most business intelligence reporting.
Diagnostic analytics answers “why it happened”—what caused delays in deliveries on specific truck routes or why a marketing campaign underperformed. It typically uses techniques like drill-down analysis and data mining to trace cause and effect through historical data.
Predictive analytics answers “what's likely to happen next”—which customers are about to churn, what a house might sell for, or what a customer might buy next. It analyzes historical and current data to forecast future outcomes, using methods like data mining and machine learning.
Prescriptive analytics answers “what to do about it”—where to reroute trucks, which product to suggest, or which lever to pull. It often relies on AI and machine learning to recommend actions that optimize outcomes.
Big data analytics tools and technologies
Big data analytics depends on a strong stack of tools for storing, processing, analyzing, and visualizing data.
Storage
In big data, storage and integration of data is critical. Different technologies cater to varied data types and processing needs:
NoSQL databases: Built for large amounts of unstructured or semi-structured data. NoSQL stands for "not only SQL"—databases that don't force data into the rigid tables SQL-based databases require. MongoDB stores data as flexible documents, which makes them more adaptable for all types of big data.
Data warehouses: Centralized stores for structured data, usually pulled from multiple sources and organized into the tables and schemas that reporting tools need.
Data lakes: Hold huge amounts of raw data in its native format—structured, semi-structured, or unstructured. MongoDB Atlas Data Lake is one example.
Lakehouses: A newer architecture that combines the structure of a warehouse with the flexibility of a lake.
Vector databases: Used for AI-powered work. They store embeddings—numerical representations of text, images, or other content—that let AI systems find meaning-based matches and pull in relevant information for user queries. This capability is called semantic search and retrieval-augmented generation (RAG). MongoDB Atlas Vector Search is built into MongoDB Atlas.
Processing
Hadoop: A long-standing framework that splits big data storage and processing across many computers working together. Hadoop's map-reduce approach—break a job into small pieces, run them in parallel, and combine the results—has been the industry standard and is still widely used, though Apache Spark now handles much of the newer big data work.
Apache Spark: A flexible open-source engine for both batch and streaming workloads.
Stream processing tools: Used when data needs to be analyzed as it arrives. MongoDB Atlas Stream Processing is one option, with native support for Apache Kafka streams.
Analysis
R and Python: The two most-used programming languages for analytics. Both have deep libraries (pre-built code packages) for statistics, machine learning, and visualization.
Data mining tools: Specialized platforms like RapidMiner and KNIME find patterns in large datasets.
AI and machine learning platforms: Cloud-based services (AWS SageMaker, Google Vertex AI, Azure ML) handle model training, deployment, and monitoring. Generative AI is increasingly part of this tech stack, too—it automates data prep, generates plain-language summaries, and answers questions without writing SQL.
Visualization
MongoDB Atlas Charts and other visualization tools turn analysis results into charts and dashboards that can be used for business intelligence.
What are the challenges to implementing big data analytics?
Big data analytics can move a business forward, but it's not easy. A few of the biggest challenges are below.
Volume and scale
Businesses are generating large amounts of data every day. Storing it, moving it between systems, and processing it can be expensive and time-consuming. Enterprise warehouses, data lakes, and lakehouses help, but they still need to be actively managed.
Data quality
Big data is messy—records get duplicated, formats "drift" over time, and sources dry up. Keeping data clean is critical because AI models will happily produce confident (but inaccurate) answers from bad data.
Security and privacy
Ensuring data security and privacy is one of the biggest challenges in big data analytics. The massive amounts of data that companies collect can include sensitive information—personal, financial, and medical—that has to be protected from breaches and misuse.
The five Vs that make big data valuable also make it harder to protect—more sources, more endpoints, more places to manage. Privacy regulations have multiplied, too. Many countries have privacy laws, each with its own rules for how data can be stored and used.
Tool sprawl
Most companies have a stack of different tools to store, process, analyze data, and visualize results. Getting these systems to talk to each other—and keeping them in sync as your tech stack changes—requires a certain level of expertise. Newer, consolidated platforms are trying to close that gap.
AI-readiness
This is the newest big data challenge. Most companies have plenty of data, but their AI projects stall because the data isn't ready—it's siloed, inconsistent, or missing the structure an AI model needs.
Where MongoDB Atlas fits in with big data analytics
MongoDB Atlas brings together several of the pieces big data analytics work depends on. Its flexible document model stores structured, semi-structured, and unstructured data without forcing it into rigid tables. The aggregation pipeline lets complex analysis run in a single query across millions of records. Federated queries can search across different clusters and cloud providers. Real-time streams are handled natively, and built-in vector search supports AI applications.
Conclusion
Collecting and storing your data is only the first step. Big data analytics relies on cleaned and processed data. AI handles a lot of that work: automating data prep, flagging anomalies, and letting business users ask questions in plain English instead of writing SQL. The result is data analysis that can be used to make strategic business decisions more quickly and confidently.
Related resources
- Big Data Examples — Learn how some industries put big data to work, from healthcare and finance to retail and manufacturing.
- Database vs. Data Warehouse vs. Data Lake — Compare three approaches to storing data and find out which fits operational, analytical, or hybrid use cases.
- What Is Real-Time Analytics? — Discover how real-time analytics turns streaming data into fast insights.
- What Is Vector Search? — See how vector search uses embeddings to find semantically similar results across unstructured data.
- MongoDB Aggregation Pipeline — Learn how the aggregation pipeline filters, groups, and transforms data through multiple stages in a single query.