Big data analytics encompasses modern tools and techniques used to collect, process, and analyze data that is huge in size, fast-changing, diverse, and can generate value for enterprises. Big data is too complex to manage with traditional tools and techniques. In this article, we discuss some important aspects of big data and how to overcome big data analytics challenges using MongoDB.
What is Big Data Analytics?
Big data analytics explained
Big data refers to structured, semi-structured, or unstructured data that is huge not only in Volume but also Velocity and Variety. The three Vs form the core characteristics of big data.
Other than these core characteristics, there are several others that we can consider. Veracity and Value are two additional Vs that are typically taken into account when evaluating the importance of the data for analytics.
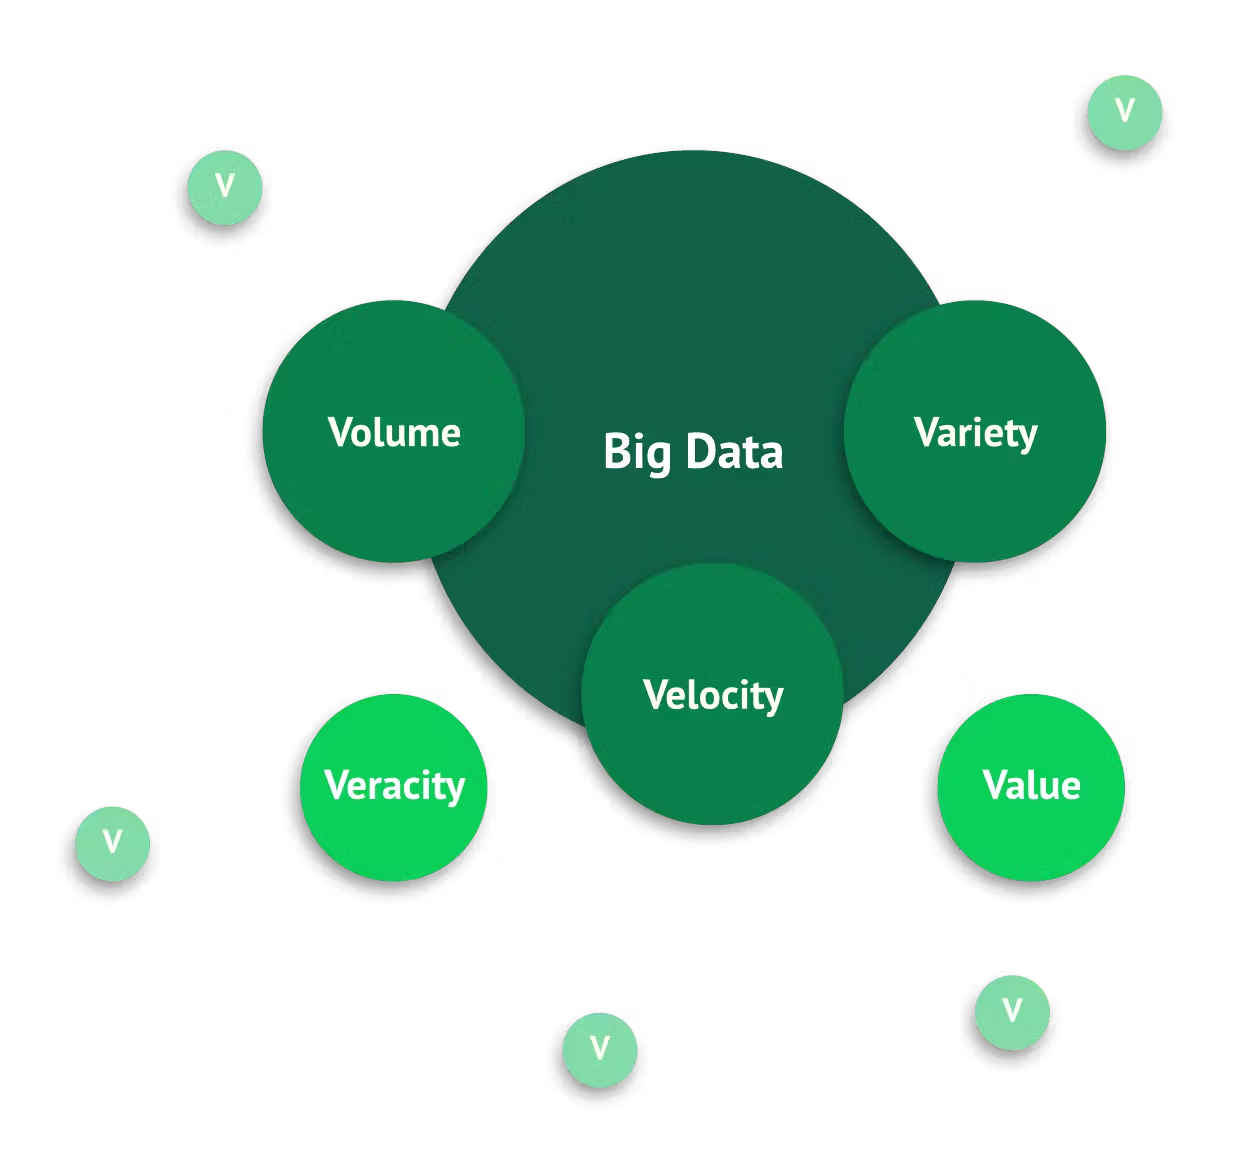
V = Other Vs of big data (Vocabulary, Vagueness, Viability ....)
Let’s take a simple example:
User Z shops for a t-shirt online from website C. Unfortunately, the t-shirt Z selects is out of stock.
The website, however, shows similar t-shirts to Z. Z ends up purchasing three t-shirts instead of one. Later, Z also gets an email from website C when the t-shirt they first selected becomes available.
This leads to more sales and happier customers — what more can a business ask for?
But how did this happen?
Over time, website C collects a lot of information (volume) about many users like Z who shop on the site. Since Z uses the same login for many similar transactions — such as food, games, and social media engagement — website C can collect different types of data about the user (variety). Website C gets data at different speeds from different sources — some live feeds, some collected over time (velocity). The website uses algorithms that can analyze this data. This analysis allows website C to get the expected Value:
- Retain the customer by providing what they want without extensive search.
- Gain greater revenue by showing more products the customer likes.
- Create an intelligent system that improves itself and works for most scenarios.
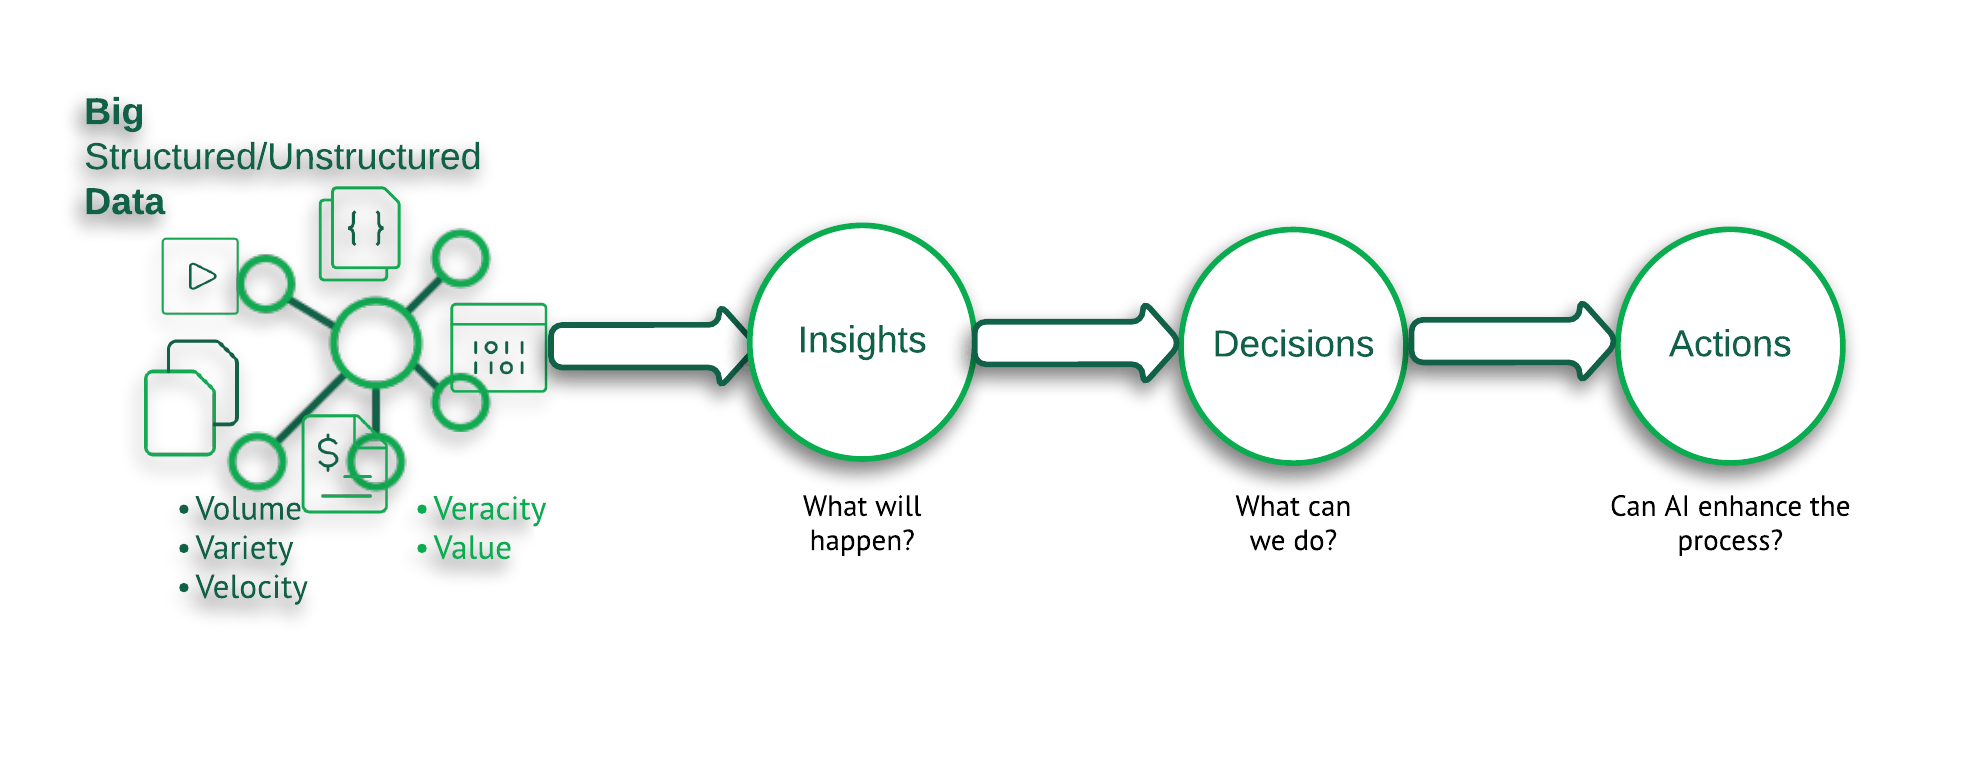
Big data analytics is the process of analyzing big data to:
- Get actionable insights.
- Uncover hidden patterns.
- Find correlations in data.
This helps businesses to save costs, improve business productivity, increase revenue, and create intelligent organizations.
The structure in which organizations organize the ingestion, processing, and analysis of big data is called big data architecture. Big data architecture ensures high performance, scalability, and choice of tools and technologies for specific use cases.
Some of the many real-world big data analytics use cases are:
- Tracking delivery trucks and providing them with the best routes for timely delivery.
- Understanding customer shopping habits and suggesting relevant products and services to them.
- Suggesting movies based on previous ratings and movies watched by users.
- Tracking and monitoring the health of users using IoT devices.
- Managing and optimizing inventory.
- Providing real-time traffic updates, weather updates, and road mapping.
Learn more about big data examples and use cases.
Why are big data analytics important?
Big data analytics power organizations for more efficient operations, intelligent business decisions, and higher profits. This leads to improved company performance:
- Cost and time reduction: Store, access, and process data in a cost-effective way. With advanced analytics techniques, analysts and data scientists get the right insights faster.
- Faster analytics and decision-making: Analyze data with NoSQL databases, Hadoop, Spark, etc. Visualize data on dashboards and make faster business decisions.
- Increased innovation: Analyze market trends and user preferences to improve existing services and products. In addition, develop better future products and services.
- Improved customer acquisition and retention: With increased awareness of customer needs, create customized marketing plans, offers, and discounts.
How big data analytics works
Big data analytics is complex and requires advanced analytics tools.
Big data analytics tools have several stages that convert data into knowledge and wisdom. The core stages are mentioned below.
Data collection and integration:
Structured or unstructured data can be collected from various sources such as:
- IoT devices.
- Social media.
- RFID.
- Images and videos.
- Cloud and mobile applications.
Many options exist for storing and integrating data from these diverse sources:
- NoSQL databases, like MongoDB
- Data warehouses
- Data lakes
Hadoop and MongoDB can be used together for big data analytics to store, integrate, and process big data in a distributed environment.
Data processing:
Data processing involves organizing and splitting the stored data for analytics. There are two main types of data for processing:
Batch: Batch processing is useful when decision-making is not urgent. Batch processing involves processing blocks of data over a period of time. Data is stored, cleaned, and transformed before performing analytics. Examples include daily operational reports, or fetching user call records to calculate charges.
Stream: Streaming data refers to data that is continuously generated, forming a data stream — either in unstructured or semi-structured form. Stream processing focuses on cleaning and processing the data stream over a sliding time window to get insights and take immediate actions. Data processing happens in smaller chunks, reducing the time between collection and analysis. For example:
- Detecting and blocking a fraudulent transaction.
- Changes in the stock market.
- Property recommendations.
- Weather data.
The above are examples of time-series data, which is one of the most common types of streaming data. Processing time-series data is usually expensive and complex because it is continuous in nature and has to be in order of (sorted by) time. MongoDB 5.0 introduces native support for time-series data, which makes working with time-series data easier, faster, and lower cost.
Data cleaning and transformation:
The data we receive may contain a lot of duplicates, missing values, outliers, extra spaces, and other such inconsistencies. The data may also need to be reformatted.
Big data engineers use statistical and data transformation tools to clean and transform data. Cleaning can be the most time-consuming task in the entire big data lifecycle.
Data analysis:
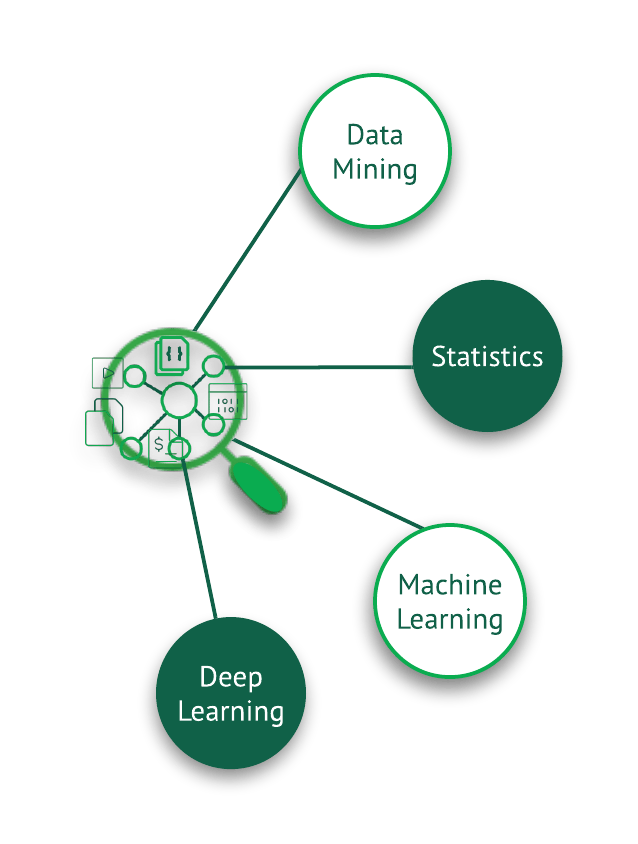
Data analysis is usually performed with a specific problem statement in hand. Based on that, analysts use the right set of algorithms and analytical Big Data technologies. Some popular big data analytics techniques are:
- Data mining: Data mining finds patterns in the data to understand “what happened.” This is usually done by identifying relationships between data and forming clusters. For example, market segmentation is done to identify customers who are more likely to purchase certain products.
- Statistics and machine learning: Statistical measures like mean, standard deviation, and correlation are the first steps to pull insights from the data. Machine learning algorithms use past and present data to perform predictive analytics. For example, travel companies can estimate the best time to book flights and hotels based on historical trends.
- Deep learning: Deep learning uses neural networks. Neural networks imitate the human brain to understand patterns in abstract and complex data. For example, virtual assistants like Alexa improve their algorithms using Natural Language Processing.
Using big data analytics
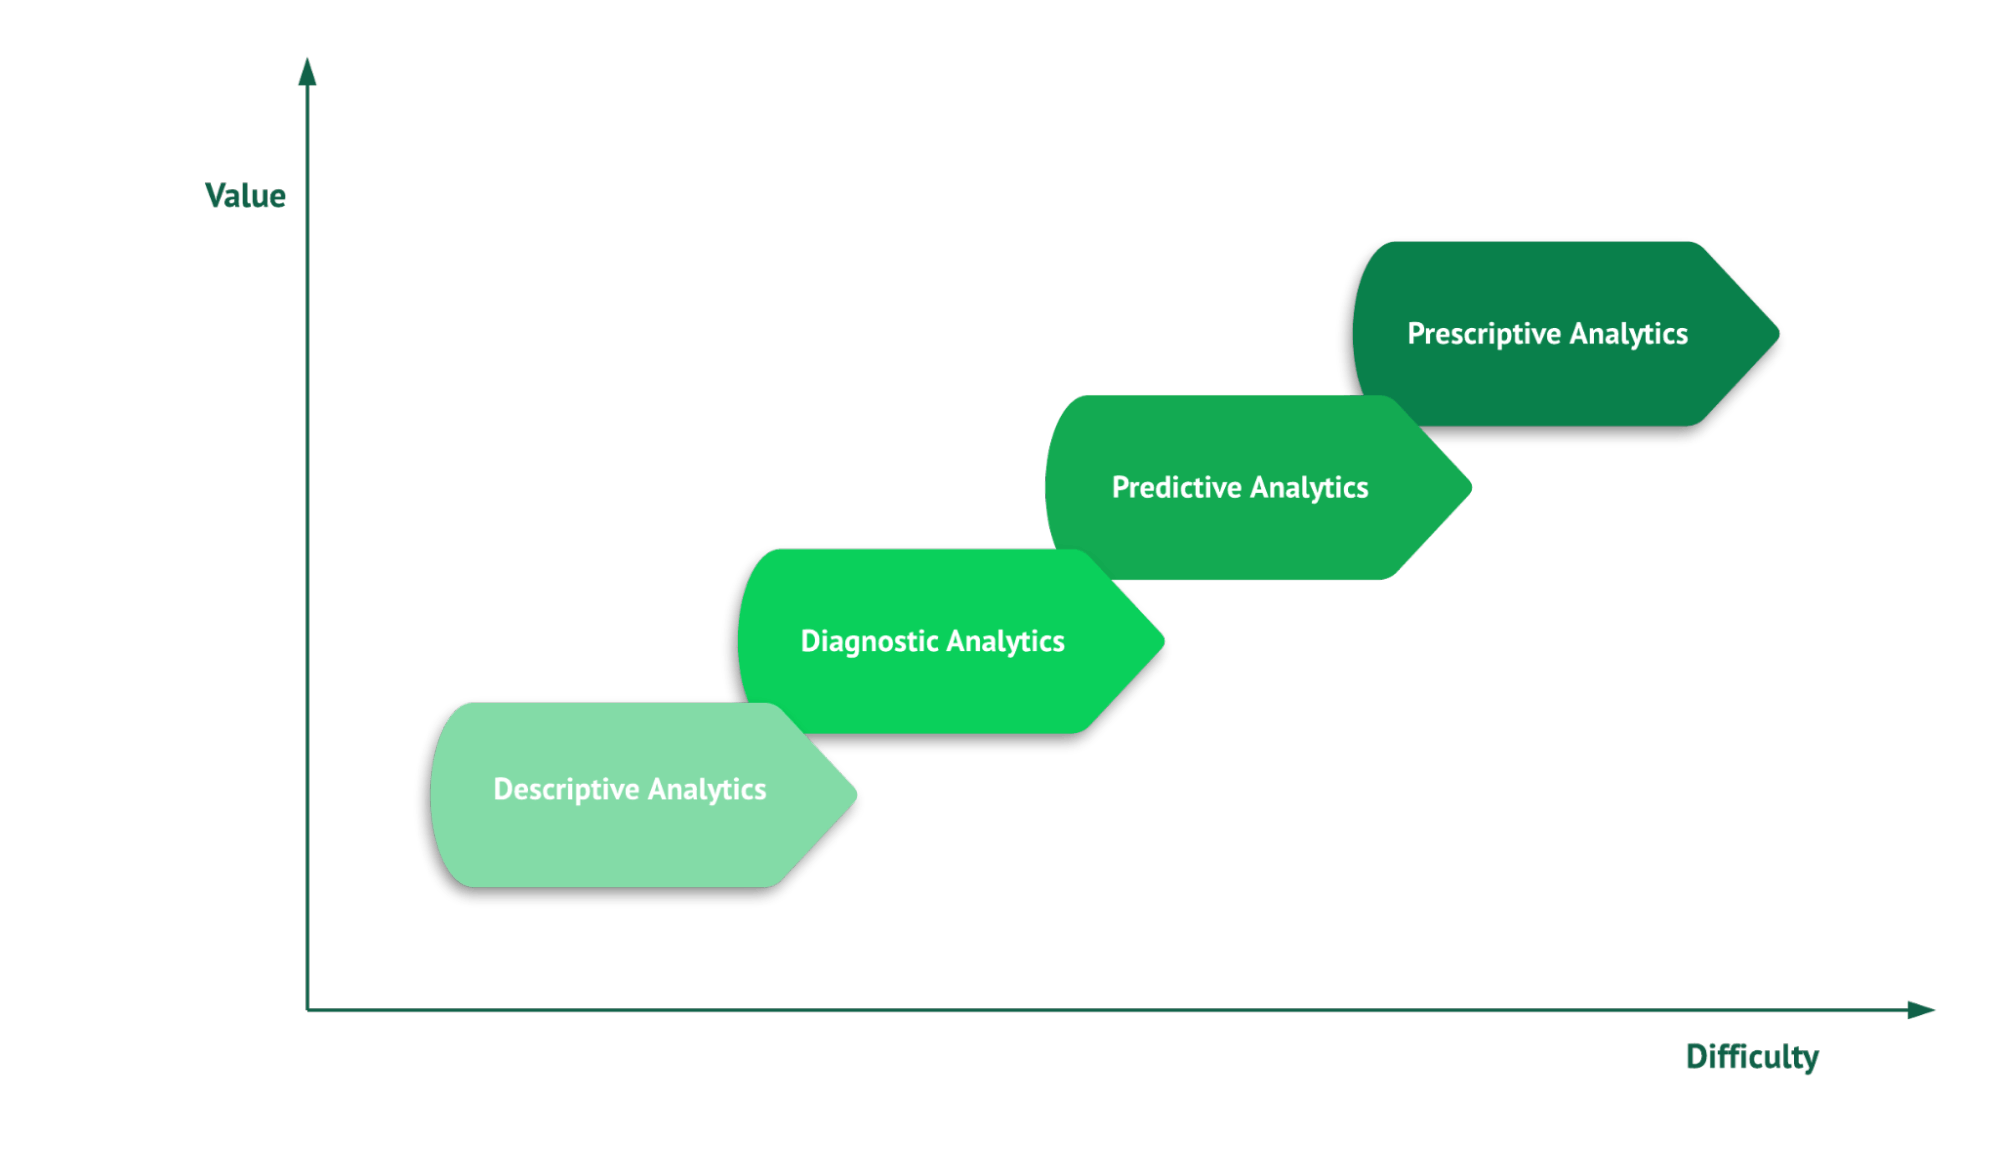
Depending on the business use case, we can perform different types of big data analytics:
- Descriptive (Information) Analytics (“what happened”): This usually falls under Business Intelligence. * * Descriptive Analytics answers questions like what, when, who, and how many. For example, assessing past and present activities and posts of a social media user, or the quarterly sales reports of a company.
- Diagnostic Analytics (“why it happened”): We use diagnostics to understand why something happened. For example, “why trucks on a particular route arrived late with the consignments.”
- Predictive Analytics (“what will happen next”): Predictive Analytics gives us a forecast for the future. Examples include projecting the value of a home based on the last six months’ market trends, or determining the shopping preferences of certain groups of customers based on their previous purchases.
- Prescriptive Analytics (“how to make it better”): Businesses use artificial intelligence and machine learning models to make decisions. They can then take necessary actions on their business strategies. For example, real-time route analysis for the goods supply, or determining types of products that sell together.
Big data analytics technologies and tools
Big data requires tools and technologies for storage, mining, analytics, and visualization. Some popular big data technologies are:
Data storage and integration
- NoSQL databases can store huge amounts of unstructured data. For example, MongoDB has a flexible schema and stores data as documents, which enables fast data retrieval and analysis.
- Hadoop framework can store and analyze data in a distributed processing environment. It uses map-reduce to retrieve data.
- For structured data, data warehouses can act as a repository to collectively store data collected from many sources.
- Data lakes are a great choice for integrating and storing huge amounts of unstructured data from a variety of sources and follow a flat architecture.
Data mining
For knowledge discovery, we need specialized data mining tools. Tools like RapidMiner, ElasticSearch etc. help find trends and patterns in big data.
Data analytics
Spark is a top open-source tool for batch and streaming data processing and analytics. R and Python also offer rich libraries to perform advanced analytics.
Blockchain analytics is also gaining popularity in terms of discovering useful information on blockchain data. Blockchain is a decentralized, distributed public ledger that can track and analyze data changes in real time, ensuring data quality and security.
Data visualization
Through big data analysis tools like Excel, Tableau, MongoDB Charts, and Plotly, we can visualize data as charts. The tools share insights and reports with business analysts and stakeholders.
Big data analytics challenges
Big data analytics can boost company performance and build intelligent systems. First, we need to overcome challenges like:
- Data storage and processing: Data is growing exponentially in size and complexity. To store and process such massive data is a daunting task. Enterprise data warehousing and data lakes are popular ways to store and process data.
- Data quality: Keeping data reliable and updated at all times requires a lot of data management effort and time. For example, imagine a company wants to view data of an ex-employee who left the organization a few years ago but has re-applied now for a different position. They’ll need to retrieve historical data and update it, instead of creating a new data record for the same person.
- Data security: Keeping data secure is a challenge due to big data characteristics (the three Vs). For instance, personal, financial, and medical data are vulnerable to attacks by hackers and cyber-criminals. As data arrives with high velocity, it can be manipulated or stolen at endpoints. In addition, ensuring access control at a granular level is tough with the volume and variety of data that is captured in data warehouses and data lakes.
- Correct tools and techniques: It is important to select the appropriate big data analytics tools based on the business problem at hand.
MongoDB Atlas solves the big data analytics challenges through its many easy-to-use features.
Atlas offers easy storage of data in the cloud and is compatible with all major cloud providers. MongoDB federated queries allow users to perform queries across various MongoDB systems, like multi-cloud clusters, databases, and AWS S3 buckets. In addition, with the MongoDB aggregation pipeline, we can retrieve the desired documents using a single query, thus taking care of data processing.
MongoDB Atlas provides various authentication and encryption methods to maintain data security. MongoDB Connector for BI is a great tool to connect with other BI tools and perform big data analytics on the MongoDB Atlas cluster. Using MongoDB Charts, we can easily visualize data patterns, key metrics, and insights.
Applications of big data analytics in business
The ultimate goal of businesses is to increase revenue by providing maximum value. Big data analytics helps companies achieve this goal by:
Managing Risk
Companies can use their historical data to perform predictive analytics. This allows them to:
- Build better short-term and long-term risk management models.
- Make strategic decisions.
- Eliminate major risks and overcome challenges in early stages of development.
Understanding market competitors
By collecting public data about competitors, businesses can provide better products and services. They can get data through social media handles, blogs, user comments, ratings, surveys, and more.
Identifying trends and patterns
Using data mining and machine learning techniques, companies can identify trends and patterns. For example, customer shopping preferences, browsing patterns, or items that users buy together.
Employing big data analytics in retail
Retail analytics helps in understanding customer needs and preferences. Companies can create customized discounts, personalized marketing campaigns, and offers. This results in better customer retention. Retail analytics also helps with supply chain and logistics management, as well as inventory management.
Creating new products
By understanding both their customers and competitors, businesses can create new, innovative products that provide more value to customers. They can also improve upon existing products to serve the same purpose.
Managing human resources
Having productive employees is crucial to the progress of the company. Big data analytics can find gaps in the employee development process and aid in making decisions for hiring, training, and development of employees.
Advantages of big data analytics in MongoDB Atlas
MongoDB offers high performance and easy data retrieval because of its embedded document-based structure. Through MongoDB MQL and aggregation pipelines, data can be retrieved and analyzed in a single query.
Some MongoDB Atlas Big Data Analytics benefits are:
- Flexible schema: MongoDB has a flexible schema. The flexible schema is beneficial for both structured and unstructured data.
- Rich query language: MongoDB provides rich expressions and query operators to get the desired data in a single query.
- Embedded document structure: MongoDB allows developers to embed documents within documents. This embedded structure stores relevant data together, so developers don't need to use complex joins to bring data together. When modeling data in MongoDB, documents that are accessed together are stored together.
- MongoDB Charts: Charts allow users to quickly and easily create visualizations of data for business intelligence and insights. We can create charts with real-time data and share them securely.
Conclusion
Big data analytics helps businesses with better decision-making, thereby increasing revenue and sales. Organizations across the world are investing a lot of money into big data analytics but face practical challenges during implementation. These challenges can be handled by the MongoDB Atlas platform. With MongoDB Atlas, organizations are serving more data, more users, and more insights with greater ease, thereby creating more value worldwide.
FAQs
Big data is data that is huge in volume, velocity, variety, and value. The process of collection, processing, cleaning, and analysis of big data to get business insights, hidden patterns, and trends is big data analytics. Many companies use big data to improve business processes, operations, and sales.
A very common example of big data analytics is the Amazon online store. Suppose a user browses through products and buys a laptop. Amazon then uses big data analytics to recommend similar products based on what other users, who also purchased a laptop, bought. This might include laptop bags and headphones that people usually buy along with a laptop.
Big data analytics finds meaningful actionable insights and patterns in data. Organizations use the insights to make appropriate decisions to improve their business performance. This helps them acquire more customers. Big data analytics has applications in domains like healthcare, finance, banking, education, etc.
Top big data analytics jobs require skills including:
* Analytical and problem solving skills.
* Programming knowledge.
* Statistics and data mining.
* Familiarity with NoSQL databases and big data tools.
* Domain knowledge.
Big data analytics can help businesses increase revenues in many ways, including:
1. Better insights into customer preferences and behavior helps businesses deliver customized products and services to users. With personalization, companies get more conversions, increasing sales and revenue.
2. By analyzing geospatial data, businesses can segment areas that can give potentially high sales and focus more on those, saving cost and increasing revenue.
3. Big data analytics encourages automation and AI to handle more user requests, again saving time and resources, and increasing revenue.
Get started with Atlas today
Get started in seconds. Our free clusters come with 512 MB of storage so you can play around with sample data and get oriented with our platform.
GET STARTED WITH:
- 125+ regions worldwide
- Sample data sets
- Always-on authentication
- End-to-end encryption
- Command line tools